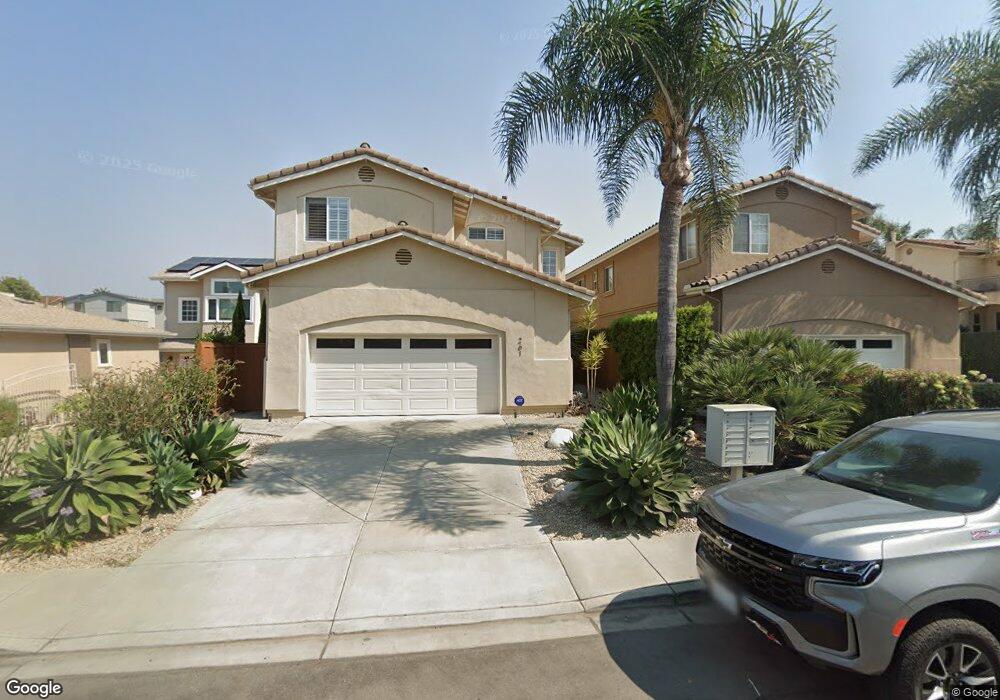
233 Chinquapin Ave Unit 6 Carlsbad, CA 92008
North Beach NeighborhoodEstimated Value: $1,646,548 - $2,072,000
3
Beds
3
Baths
2,066
Sq Ft
$892/Sq Ft
Est. Value
About This Home
This home is located at 233 Chinquapin Ave Unit 6, Carlsbad, CA 92008 and is currently estimated at $1,843,387, approximately $892 per square foot. 233 Chinquapin Ave Unit 6 is a home located in San Diego County with nearby schools including Carlsbad High School, Sage Creek High, and St. Patrick Catholic School.
Ownership History
Date
Name
Owned For
Owner Type
Purchase Details
Closed on
Nov 8, 2017
Sold by
Thalasinos John Arthur and Thalasinos Terry Lynn
Bought by
Thalasinos John A and Thalasinos Terry L
Current Estimated Value
Purchase Details
Closed on
Mar 26, 2012
Sold by
Price Gregory Walter and Price Robin Elen
Bought by
Thalasinos John Arthur and Thalasinos Terry Lynn
Purchase Details
Closed on
Sep 19, 2001
Sold by
Carlsbad Beach Group Investors
Bought by
Price Gregory Walter and Price Robin Elen
Home Financials for this Owner
Home Financials are based on the most recent Mortgage that was taken out on this home.
Original Mortgage
$275,000
Interest Rate
6.62%
Mortgage Type
Purchase Money Mortgage
Create a Home Valuation Report for This Property
The Home Valuation Report is an in-depth analysis detailing your home's value as well as a comparison with similar homes in the area
Home Values in the Area
Average Home Value in this Area
Purchase History
| Date | Buyer | Sale Price | Title Company |
|---|---|---|---|
| Thalasinos John A | -- | None Available | |
| Thalasinos John Arthur | $500,000 | Chicago Title Company | |
| Price Gregory Walter | $455,000 | Fidelity National Title |
Source: Public Records
Mortgage History
| Date | Status | Borrower | Loan Amount |
|---|---|---|---|
| Previous Owner | Price Gregory Walter | $275,000 |
Source: Public Records
Tax History Compared to Growth
Tax History
| Year | Tax Paid | Tax Assessment Tax Assessment Total Assessment is a certain percentage of the fair market value that is determined by local assessors to be the total taxable value of land and additions on the property. | Land | Improvement |
|---|---|---|---|---|
| 2025 | $7,284 | $632,477 | $345,064 | $287,413 |
| 2024 | $7,284 | $620,077 | $338,299 | $281,778 |
| 2023 | $7,251 | $607,919 | $331,666 | $276,253 |
| 2022 | $7,149 | $596,000 | $325,163 | $270,837 |
| 2021 | $7,100 | $584,315 | $318,788 | $265,527 |
| 2020 | $7,057 | $578,325 | $315,520 | $262,805 |
| 2019 | $6,941 | $566,986 | $309,334 | $257,652 |
| 2018 | $6,633 | $551,948 | $303,269 | $248,679 |
| 2017 | $6,534 | $541,126 | $297,323 | $243,803 |
| 2016 | $6,297 | $530,517 | $291,494 | $239,023 |
| 2015 | $6,262 | $522,549 | $287,116 | $235,433 |
| 2014 | $6,168 | $512,314 | $281,492 | $230,822 |
Source: Public Records
Map
Nearby Homes
- 312 Chinquapin Ave
- 314 Chinquapin Ave
- 320 Chinquapin Ave
- 324 Chinquapin Ave
- 111 Sequoia Ave Unit C
- 334 Date Ave
- 370 Tamarack Ave
- 4007 Canario St Unit E
- 4009 Canario St Unit H
- 160 Hemlock Ave
- 368 Hemlock Ave
- 385 Juniper Ave
- 256 Juniper Ave Unit B6
- 141 Cherry Ave
- Cherry Beach Homes Plan at Cherry Beach Homes - Cherry Beach homes
- 801 Kalpati Cir Unit B
- 164 Cherry Ave
- 4020 Layang Cir Unit C
- 832 Kalpati Cir Unit E
- 817 Kalpati Cir Unit 212
- 245 Chinquapin Ave Unit 3
- 299 Chinquapin Ave
- 291 Chinquapin Ave
- 237 Chinquapin Ave
- 249 Chinquapin Ave Unit 2
- 241 Chinquapin Ave Unit 4
- 265 Chinquapin Ave
- 261 Chinquapin Ave
- 257 Chinquapin Ave
- 305 Chinquapin Ave Unit 11
- 229 Chinquapin Ave
- 234 Date Ave
- 4038 Garfield St
- 4036 Garfield St
- 4052 Garfield St
- 4040 Garfield St
- 4044 Garfield St Unit 6
- 319 Chinquapin Ave
- 4028 Garfield St
- 4054 Garfield St Unit 11