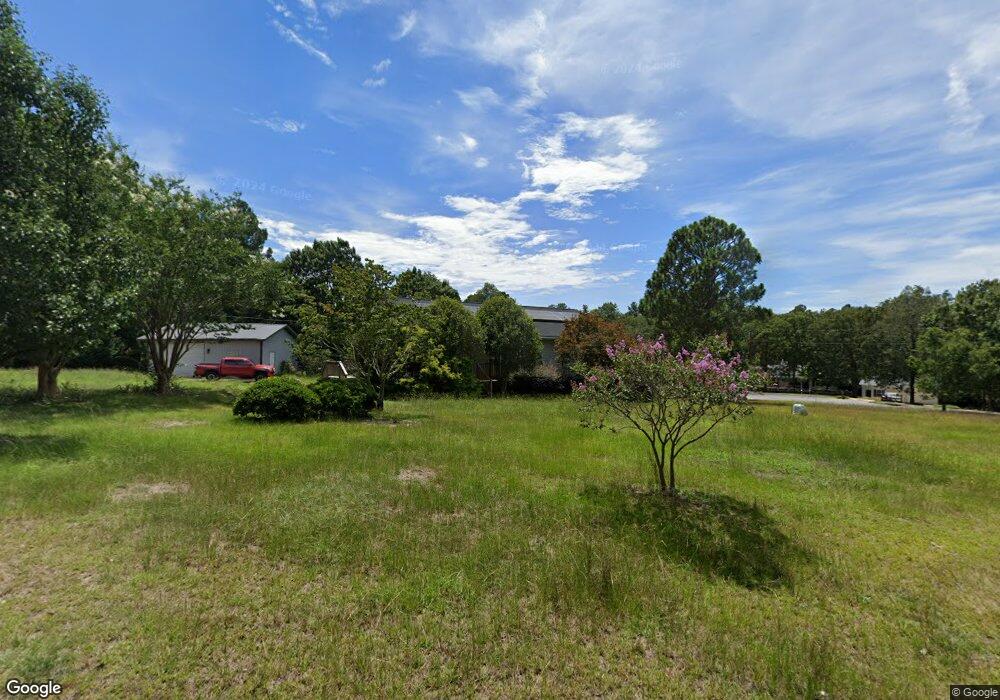
233 Drawdebil Ct Gilbert, SC 29054
Estimated Value: $239,910 - $279,000
3
Beds
2
Baths
1,436
Sq Ft
$183/Sq Ft
Est. Value
About This Home
This home is located at 233 Drawdebil Ct, Gilbert, SC 29054 and is currently estimated at $262,228, approximately $182 per square foot. 233 Drawdebil Ct is a home located in Lexington County with nearby schools including Centerville Elementary School, Gilbert Middle School, and Gilbert High School.
Ownership History
Date
Name
Owned For
Owner Type
Purchase Details
Closed on
Jan 20, 2017
Sold by
Rich Robert E
Bought by
Crossley Christine Nicole
Current Estimated Value
Home Financials for this Owner
Home Financials are based on the most recent Mortgage that was taken out on this home.
Original Mortgage
$13,000
Outstanding Balance
$10,768
Interest Rate
4.3%
Mortgage Type
Mortgage Modification
Estimated Equity
$251,460
Purchase Details
Closed on
Feb 28, 2002
Sold by
Chase Manhattan Mtg Corp
Bought by
Rich Robert E
Purchase Details
Closed on
Sep 26, 2001
Sold by
Williams S Samantha
Bought by
Miller David Lee
Purchase Details
Closed on
Sep 14, 2001
Sold by
Master In Equity
Bought by
Chase Manhattan Mtg Corp
Create a Home Valuation Report for This Property
The Home Valuation Report is an in-depth analysis detailing your home's value as well as a comparison with similar homes in the area
Home Values in the Area
Average Home Value in this Area
Purchase History
| Date | Buyer | Sale Price | Title Company |
|---|---|---|---|
| Crossley Christine Nicole | $130,000 | None Available | |
| Rich Robert E | $78,850 | -- | |
| Yarborough Angela D | $72,000 | -- | |
| Miller David Lee | $140,000 | -- | |
| Chase Manhattan Mtg Corp | $71,000 | -- |
Source: Public Records
Mortgage History
| Date | Status | Borrower | Loan Amount |
|---|---|---|---|
| Open | Crossley Christine Nicole | $13,000 |
Source: Public Records
Tax History
| Year | Tax Paid | Tax Assessment Tax Assessment Total Assessment is a certain percentage of the fair market value that is determined by local assessors to be the total taxable value of land and additions on the property. | Land | Improvement |
|---|---|---|---|---|
| 2024 | $848 | $5,200 | $960 | $4,240 |
| 2023 | $776 | $5,200 | $960 | $4,240 |
| 2022 | $774 | $5,200 | $960 | $4,240 |
| 2020 | $794 | $5,200 | $960 | $4,240 |
| 2019 | $808 | $5,200 | $800 | $4,400 |
| 2018 | $793 | $5,200 | $800 | $4,400 |
| 2017 | $569 | $3,836 | $600 | $3,236 |
| 2016 | $563 | $3,835 | $600 | $3,235 |
| 2014 | $599 | $4,271 | $640 | $3,631 |
| 2013 | -- | $4,270 | $640 | $3,630 |
Source: Public Records
Map
Nearby Homes
- 0 Hayes Crossing Rd Unit 623276
- 0 Hayes Crossing Rd Unit 623177
- 0 Hayes Crossing Rd Unit 623279
- 0 Hayes Crossing Rd Unit 623180
- 360 Twisting Rd
- 527 Marcus Way
- 237 Bones Rd
- 122 Stock Rd
- 527 Semm Sease Rd
- 1547 Meditation Ln
- 615 Juniper Springs Rd
- 622 Juniper Springs Rd
- 331 Red Globe Trail
- 163 Summer Orchard Dr
- 638 Glacier Rd
- 642 Glacier Rd
- 634 Glacier Rd
- 647 Glacier Rd
- 637 Glacier Rd
- 436 Peach Festival Rd
- 241 Drawdebil Ct
- 221 Drawdebil Ct
- 234 Drawdebil Ct
- 236 Drawdebil Ct
- 226 Drawdebil Ct
- 230 Drawdebil Ct
- 240 Drawdebil Ct
- 220 Drawdebil Ct
- 248 Drawdebil Ct
- 244 Drawdebil Ct
- 215 Drawdebil Ct
- 966 Drawdebil Rd
- 966 Drawdebil Rd
- 1028 Drawdebil Rd
- 1016 Drawdebil Rd
- 1020 Drawdebil Rd
- 1008 Drawdebil Rd
- 1030 Drawdebil Rd
- 1004 Drawdebil Rd
- 1024 Drawdebil Rd
Your Personal Tour Guide
Ask me questions while you tour the home.