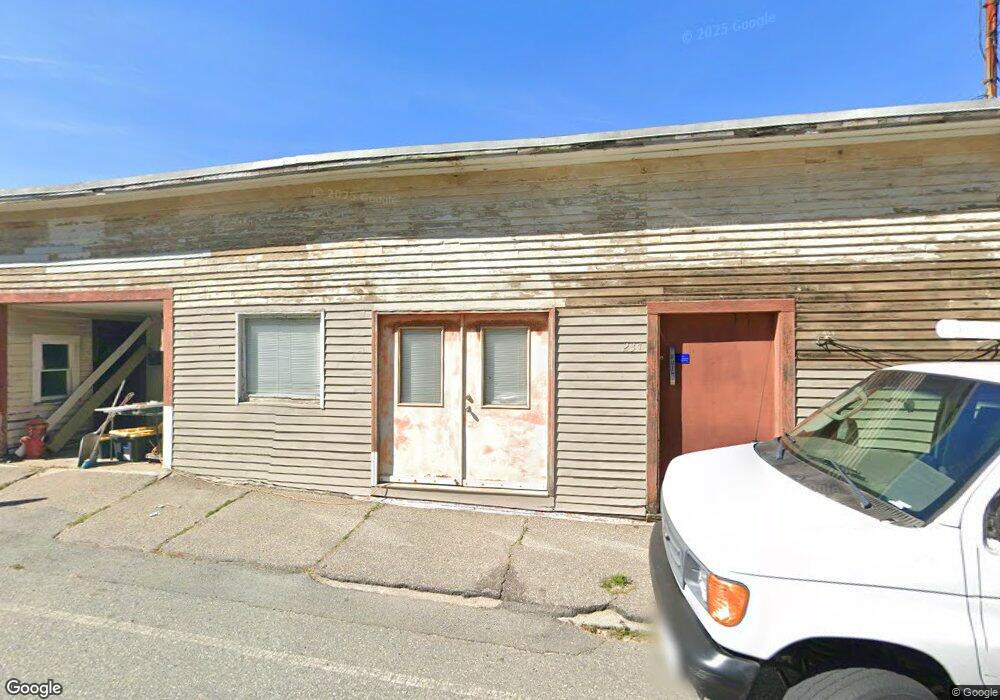
233 E Main St Gloucester, MA 01930
East Gloucester NeighborhoodEstimated Value: $740,180
1
Bed
1
Bath
8,673
Sq Ft
$85/Sq Ft
Est. Value
About This Home
This home is located at 233 E Main St, Gloucester, MA 01930 and is currently estimated at $740,180, approximately $85 per square foot. 233 E Main St is a home located in Essex County with nearby schools including East Gloucester Elementary School, Ralph B O'maley Middle School, and Gloucester High School.
Ownership History
Date
Name
Owned For
Owner Type
Purchase Details
Closed on
Dec 3, 2013
Sold by
Morse Thomas C and Morse Bertha H
Bought by
Mnm Rt
Current Estimated Value
Home Financials for this Owner
Home Financials are based on the most recent Mortgage that was taken out on this home.
Original Mortgage
$270,000
Outstanding Balance
$202,442
Interest Rate
4.29%
Mortgage Type
Commercial
Estimated Equity
$537,738
Purchase Details
Closed on
Sep 9, 2008
Sold by
Morse Thomas C
Bought by
Morse Thomas C
Create a Home Valuation Report for This Property
The Home Valuation Report is an in-depth analysis detailing your home's value as well as a comparison with similar homes in the area
Home Values in the Area
Average Home Value in this Area
Purchase History
| Date | Buyer | Sale Price | Title Company |
|---|---|---|---|
| Mnm Rt | $360,000 | -- | |
| Morse Thomas C | -- | -- |
Source: Public Records
Mortgage History
| Date | Status | Borrower | Loan Amount |
|---|---|---|---|
| Open | Morse Thomas C | $270,000 |
Source: Public Records
Tax History
| Year | Tax Paid | Tax Assessment Tax Assessment Total Assessment is a certain percentage of the fair market value that is determined by local assessors to be the total taxable value of land and additions on the property. | Land | Improvement |
|---|---|---|---|---|
| 2025 | $5,267 | $524,600 | $262,000 | $262,600 |
| 2024 | $5,099 | $507,400 | $249,600 | $257,800 |
| 2023 | $5,204 | $475,700 | $222,800 | $252,900 |
| 2022 | $5,119 | $422,400 | $184,100 | $238,300 |
| 2021 | $5,118 | $398,300 | $167,300 | $231,000 |
| 2020 | $4,999 | $392,400 | $167,300 | $225,100 |
| 2019 | $5,083 | $387,700 | $167,300 | $220,400 |
| 2018 | $5,083 | $380,500 | $167,300 | $213,200 |
| 2017 | $4,982 | $365,500 | $159,400 | $206,100 |
| 2016 | $5,074 | $349,200 | $159,600 | $189,600 |
| 2015 | $5,091 | $349,200 | $159,600 | $189,600 |
Source: Public Records
Map
Nearby Homes
- 73 Rocky Neck Ave Unit 2
- 197 E Main St Unit 1
- 197 E Main St Unit 2
- 30 Chapel St Unit B
- 15 Raven Ln Unit 15
- 10 Seaview Rd
- 191 Main St Unit 3
- 191 Main St Unit 2A
- 160 Prospect St Unit 3
- 11 Ocean View Dr
- 33 Middle St
- 10 Oak St Unit 3
- 55 Mansfield St Unit A
- 55 Mansfield St Unit B
- 55 Mansfield St
- 113 Pleasant St
- 5 Wise Place
- 33 Maplewood Ave Unit 16
- 87 Atlantic Rd Unit 2
- 19 Trask St Unit 2
- 237 E Main St
- 239 E Main St
- 239 E Main St Unit 1
- 239 E Main St
- 243 E Main St
- 212 E Main St
- 245 E Main St
- 220 E Main St
- 125 Mount Pleasant Ave
- 121 Mount Pleasant Ave
- 3 Banner Hill Way
- 247 E Main St
- 119 Mount Pleasant Ave
- 226 E Main St
- 123 Mount Pleasant Ave
- 249 E Main St
- 249 E Main St Unit 2
- 228 E Main St
- 2 Banner Hill Way
- 127 Mount Pleasant Ave
Your Personal Tour Guide
Ask me questions while you tour the home.