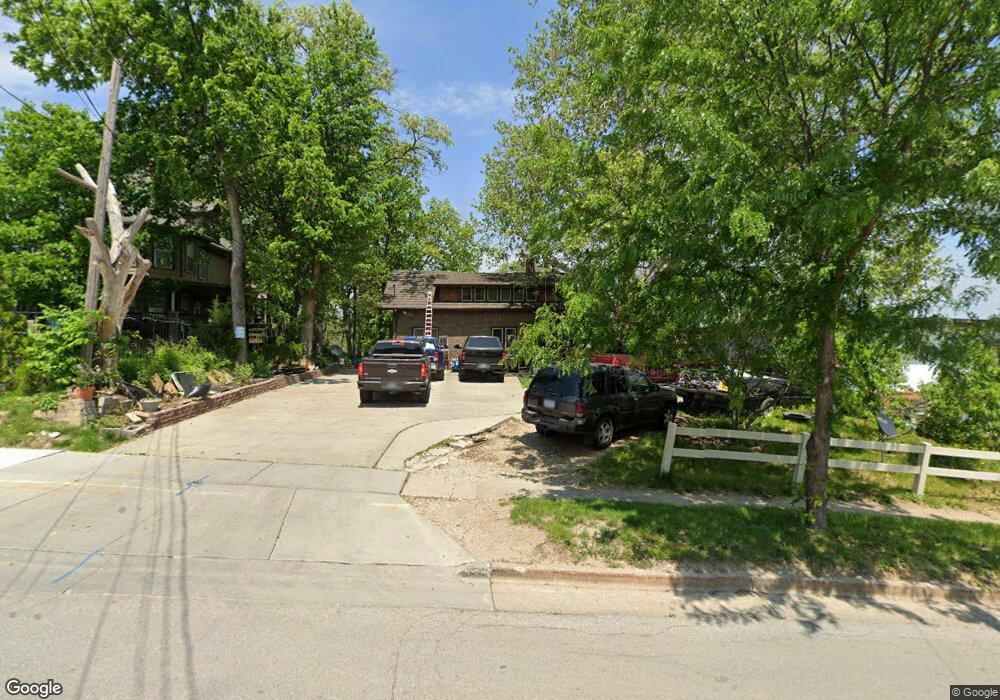
233 Franklin Ave Des Moines, IA 50314
River Bend NeighborhoodEstimated Value: $216,000 - $255,000
4
Beds
2
Baths
2,204
Sq Ft
$103/Sq Ft
Est. Value
About This Home
This home is located at 233 Franklin Ave, Des Moines, IA 50314 and is currently estimated at $227,970, approximately $103 per square foot. 233 Franklin Ave is a home located in Polk County with nearby schools including Moulton Elementary School, Harding Middle School, and North High School.
Ownership History
Date
Name
Owned For
Owner Type
Purchase Details
Closed on
Nov 18, 2011
Sold by
Csmc Inc
Bought by
Jurado Veronica
Current Estimated Value
Purchase Details
Closed on
Jul 1, 2008
Sold by
Mcnear Florence
Bought by
Towers Steve and Towers Karen
Purchase Details
Closed on
May 2, 2008
Sold by
Towers Steve and Towers Karen
Bought by
Mcnear Florence
Purchase Details
Closed on
Jul 11, 2006
Sold by
Langford Charles and Langford Tammy Davis
Bought by
Towers Steven
Home Financials for this Owner
Home Financials are based on the most recent Mortgage that was taken out on this home.
Original Mortgage
$88,000
Interest Rate
6.73%
Mortgage Type
Purchase Money Mortgage
Purchase Details
Closed on
Apr 21, 2006
Sold by
Leporte Donald C and Leporte Marjorie L
Bought by
Langford Charles and Langford Tammy Davis
Home Financials for this Owner
Home Financials are based on the most recent Mortgage that was taken out on this home.
Original Mortgage
$20,117
Interest Rate
6.42%
Mortgage Type
Purchase Money Mortgage
Create a Home Valuation Report for This Property
The Home Valuation Report is an in-depth analysis detailing your home's value as well as a comparison with similar homes in the area
Home Values in the Area
Average Home Value in this Area
Purchase History
| Date | Buyer | Sale Price | Title Company |
|---|---|---|---|
| Jurado Veronica | $23,500 | None Available | |
| Towers Steve | -- | None Available | |
| Mcnear Florence | -- | None Available | |
| Towers Steven | $47,000 | None Available | |
| Langford Charles | $45,000 | None Available |
Source: Public Records
Mortgage History
| Date | Status | Borrower | Loan Amount |
|---|---|---|---|
| Previous Owner | Towers Steven | $88,000 | |
| Previous Owner | Langford Charles | $20,117 |
Source: Public Records
Tax History Compared to Growth
Tax History
| Year | Tax Paid | Tax Assessment Tax Assessment Total Assessment is a certain percentage of the fair market value that is determined by local assessors to be the total taxable value of land and additions on the property. | Land | Improvement |
|---|---|---|---|---|
| 2025 | $3,072 | $181,000 | $21,500 | $159,500 |
| 2024 | $3,072 | $156,200 | $18,500 | $137,700 |
| 2023 | $2,928 | $156,200 | $18,500 | $137,700 |
| 2022 | $2,904 | $124,200 | $15,400 | $108,800 |
| 2021 | $2,700 | $124,200 | $15,400 | $108,800 |
| 2020 | $2,806 | $108,200 | $13,500 | $94,700 |
| 2019 | $2,650 | $108,200 | $13,500 | $94,700 |
| 2018 | $2,624 | $98,600 | $12,200 | $86,400 |
| 2017 | $2,480 | $98,600 | $12,200 | $86,400 |
| 2016 | $2,416 | $91,700 | $10,300 | $81,400 |
| 2015 | $2,416 | $91,700 | $10,300 | $81,400 |
| 2014 | $2,362 | $88,900 | $10,100 | $78,800 |
Source: Public Records
Map
Nearby Homes
- 1930 Arlington Ave
- 410 Franklin Ave
- 1825 7th St
- 1908 7th St
- 717 Franklin Ave
- 1915 8th St
- 2009 10th St
- 1729 10th St
- 1711 10th St
- 1910 10th St
- 2305 Saylor Rd
- 1427 7th St
- 1021 Franklin Ave
- 335 Forest Ave Unit 21
- 335 Forest Ave Unit 24
- 335 Forest Ave Unit 22
- 335 Forest Ave Unit 23
- 335 Forest Ave
- 1534 9th St
- 1530 9th St
- 229 Franklin Ave
- 241 Franklin Ave
- 237 Franklin Ave
- 226 Franklin Ave
- 217 Franklin Ave
- 246 Franklin Ave
- 236 Franklin Ave
- 222 Franklin Ave
- 218 Franklin Ave
- 250 Franklin Ave
- 253 Franklin Ave
- 1917 Arlington Ave
- 300 Franklin Ave
- 1809 Arlington Ave Unit 6
- 1809 Arlington Ave Unit 2
- 1809 Arlington Ave
- 1809 Arlington Ave Unit 9
- 1809 Arlington Ave Unit 10
- 1818 Arlington Ave
- 1900 Arlington Ave