Estimated Value: $316,896 - $344,000
3
Beds
2
Baths
1,659
Sq Ft
$199/Sq Ft
Est. Value
About This Home
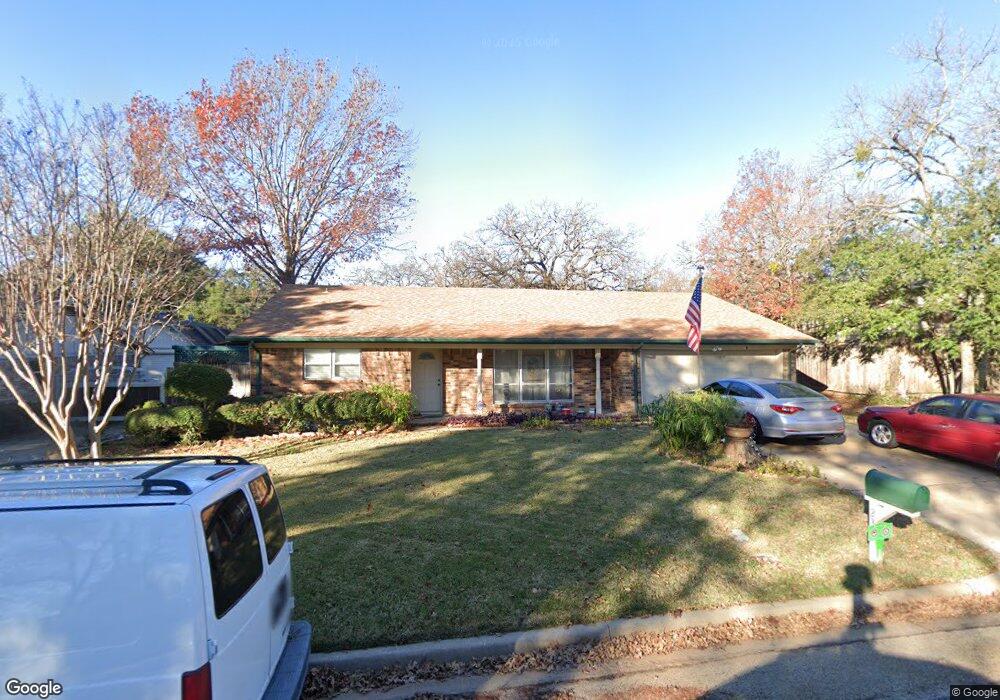
This home is located at 233 Glenn Dr, Hurst, TX 76053 and is currently estimated at $330,224, approximately $199 per square foot. 233 Glenn Dr is a home located in Tarrant County with nearby schools including Jack C Binion Elementary School, Richland Middle School, and Birdville High School.
Ownership History
Date
Name
Owned For
Owner Type
Purchase Details
Closed on
Jan 17, 2013
Sold by
Rose Terry A
Bought by
Rose Terry Alan and Terry Alan Rose Trust
Current Estimated Value
Purchase Details
Closed on
Oct 28, 2004
Sold by
Talbott Troy Don
Bought by
Rose Terry A
Home Financials for this Owner
Home Financials are based on the most recent Mortgage that was taken out on this home.
Original Mortgage
$120,555
Outstanding Balance
$64,475
Interest Rate
6.87%
Mortgage Type
Purchase Money Mortgage
Estimated Equity
$265,749
Create a Home Valuation Report for This Property
The Home Valuation Report is an in-depth analysis detailing your home's value as well as a comparison with similar homes in the area
Home Values in the Area
Average Home Value in this Area
Purchase History
| Date | Buyer | Sale Price | Title Company |
|---|---|---|---|
| Rose Terry Alan | -- | None Available | |
| Rose Terry A | -- | Fidelity National Title |
Source: Public Records
Mortgage History
| Date | Status | Borrower | Loan Amount |
|---|---|---|---|
| Open | Rose Terry A | $120,555 |
Source: Public Records
Tax History
| Year | Tax Paid | Tax Assessment Tax Assessment Total Assessment is a certain percentage of the fair market value that is determined by local assessors to be the total taxable value of land and additions on the property. | Land | Improvement |
|---|---|---|---|---|
| 2025 | $961 | $225,141 | $60,625 | $164,516 |
| 2024 | $961 | $225,141 | $60,625 | $164,516 |
| 2023 | $1,014 | $229,068 | $50,500 | $178,568 |
| 2022 | $4,977 | $201,303 | $50,532 | $150,771 |
| 2021 | $4,832 | $186,262 | $50,000 | $136,262 |
| 2020 | $5,363 | $208,702 | $50,000 | $158,702 |
| 2019 | $5,414 | $217,216 | $50,000 | $167,216 |
| 2018 | $2,388 | $187,272 | $25,000 | $162,272 |
| 2017 | $4,543 | $173,541 | $25,000 | $148,541 |
| 2016 | $4,130 | $167,227 | $25,000 | $142,227 |
| 2015 | $2,432 | $140,700 | $20,000 | $120,700 |
| 2014 | $2,432 | $140,700 | $20,000 | $120,700 |
Source: Public Records
Map
Nearby Homes
- 116 Cooper Dr
- 1208 Harris Ave
- 1204 Crestview Dr
- 549 Greenwood Cir
- 7620 Brooks Ave
- 8228 Fall Crest Dr
- 420 Twin Creek Dr
- 609 Melbourne Rd
- 612 Melbourne Ct
- 632 Melbourne Ct
- 8312 Trinity Vista Trail
- 7436 Bridges Ave
- 3617 Granada Dr
- 3608 Labadie Dr
- 512 Billie Ruth Ln
- 3616 Labadie Dr
- 3800 Oxley Dr
- 623 Ridgeline Dr
- 3720 Granada Dr
- 3717 Granada Dr
Your Personal Tour Guide
Ask me questions while you tour the home.