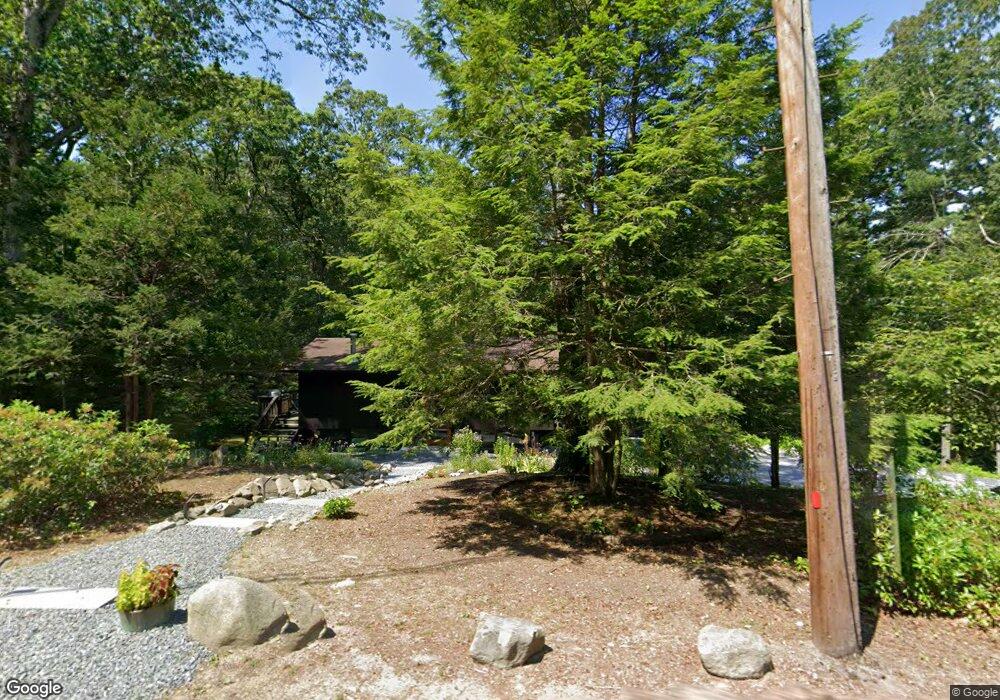
233 Heald Rd Carlisle, MA 01741
Estimated Value: $1,095,000 - $1,190,000
3
Beds
2
Baths
2,028
Sq Ft
$561/Sq Ft
Est. Value
About This Home
This home is located at 233 Heald Rd, Carlisle, MA 01741 and is currently estimated at $1,138,184, approximately $561 per square foot. 233 Heald Rd is a home located in Middlesex County with nearby schools including Carlisle School and Middlesex School.
Ownership History
Date
Name
Owned For
Owner Type
Purchase Details
Closed on
Jun 8, 2010
Sold by
Ferrick David A
Bought by
Shelkowitz Jason and Knight Cella
Current Estimated Value
Home Financials for this Owner
Home Financials are based on the most recent Mortgage that was taken out on this home.
Original Mortgage
$417,000
Interest Rate
5.12%
Mortgage Type
Purchase Money Mortgage
Purchase Details
Closed on
Feb 16, 2006
Sold by
Riccobono Juanita R and Shrauger Vernon E
Bought by
Ferrick David A
Home Financials for this Owner
Home Financials are based on the most recent Mortgage that was taken out on this home.
Original Mortgage
$417,000
Interest Rate
6.23%
Mortgage Type
Purchase Money Mortgage
Purchase Details
Closed on
Jul 9, 1999
Sold by
Ashton Halen Mary
Bought by
Shrauger Vernon E and Riccobono Janita R
Purchase Details
Closed on
Mar 25, 1988
Sold by
Murphy John F
Bought by
Alskhton Peter S
Create a Home Valuation Report for This Property
The Home Valuation Report is an in-depth analysis detailing your home's value as well as a comparison with similar homes in the area
Home Values in the Area
Average Home Value in this Area
Purchase History
| Date | Buyer | Sale Price | Title Company |
|---|---|---|---|
| Shelkowitz Jason | $525,000 | -- | |
| Ferrick David A | $525,000 | -- | |
| Shrauger Vernon E | $364,000 | -- | |
| Alskhton Peter S | $284,500 | -- |
Source: Public Records
Mortgage History
| Date | Status | Borrower | Loan Amount |
|---|---|---|---|
| Open | Alskhton Peter S | $417,000 | |
| Closed | Shelkowitz Jason | $417,000 | |
| Previous Owner | Ferrick David A | $417,000 | |
| Previous Owner | Alskhton Peter S | $275,000 |
Source: Public Records
Tax History Compared to Growth
Tax History
| Year | Tax Paid | Tax Assessment Tax Assessment Total Assessment is a certain percentage of the fair market value that is determined by local assessors to be the total taxable value of land and additions on the property. | Land | Improvement |
|---|---|---|---|---|
| 2025 | $13,848 | $1,050,700 | $567,400 | $483,300 |
| 2024 | $13,561 | $1,017,300 | $523,800 | $493,500 |
| 2023 | $13,352 | $943,600 | $501,600 | $442,000 |
| 2022 | $10,515 | $637,300 | $414,200 | $223,100 |
| 2021 | $10,375 | $637,300 | $414,200 | $223,100 |
| 2020 | $10,087 | $549,400 | $327,100 | $222,300 |
| 2019 | $9,493 | $519,000 | $327,100 | $191,900 |
| 2018 | $9,430 | $519,000 | $327,100 | $191,900 |
| 2017 | $9,145 | $519,000 | $327,100 | $191,900 |
| 2016 | $8,927 | $519,000 | $327,100 | $191,900 |
| 2015 | $8,883 | $467,500 | $314,000 | $153,500 |
| 2014 | $8,714 | $467,500 | $314,000 | $153,500 |
Source: Public Records
Map
Nearby Homes
- 0 Heald Rd
- 0 Judy Farm Rd
- 875 Acton St
- 1420 Curve St
- 927 Main St
- 1 Garrison Way Unit 1
- 27 Hartland Way Unit 309
- 17 Northbriar Rd
- 1056 Curve St
- 1 Quarry Rd
- 232 Baldwin Rd
- 225 Lowell St
- 122 Carlisle Rd
- 6 Bittersweet Ln
- 7 Blue Heron Way
- 10 Blue Heron Way Unit 10
- 10 Blue Heron Way
- 407 Great Rd Unit 9
- 403 Great Rd Unit 5
- 428 Great Rd Unit 10
- 217 Heald Rd
- 229 Heald Rd
- 246 Heald Rd
- Lots 1&3 Judy Farm Rd
- Lot 1 Judy Farm Rd
- Lot 3 Judy Farm Rd
- 3 Judy Farm Rd
- 1 Judy Farm Rd
- 190 Heald Rd
- 274 Heald Rd
- 61 Judy Farm Rd
- 20 Judy Farm Rd
- 20 Judy Farm Rd Unit 1
- 168 Heald Rd
- 296 Heald Rd
- 299 Heald Rd
- 78 Berry Corner Ln
- 54 Judy Farm Rd
- 54 Judy Farm Rd Unit A
- 65 Judy Farm Rd