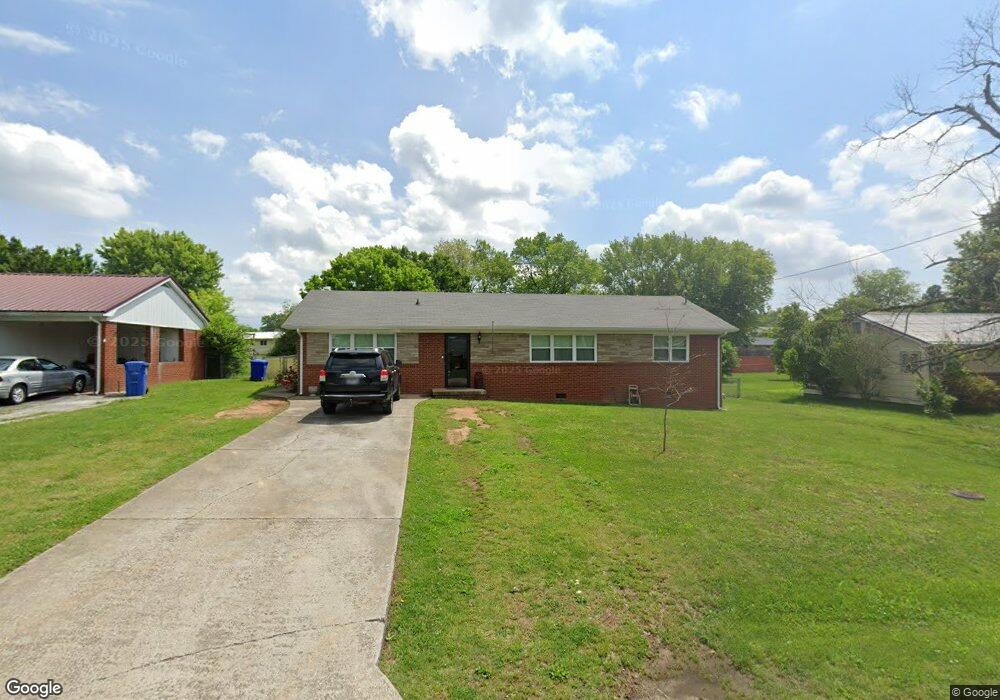
233 Laurel St Morristown, TN 37813
Estimated Value: $202,093 - $268,000
Studio
2
Baths
1,430
Sq Ft
$165/Sq Ft
Est. Value
About This Home
This home is located at 233 Laurel St, Morristown, TN 37813 and is currently estimated at $235,773, approximately $164 per square foot. 233 Laurel St is a home located in Hamblen County with nearby schools including Hillcrest Elementary School, Meadowview Middle School, and Morristown East High School.
Ownership History
Date
Name
Owned For
Owner Type
Purchase Details
Closed on
Feb 16, 2018
Sold by
Seals Thelma Ann and Seals Scottie D
Bought by
Seals Scottie D and Seals Thelma Ann
Current Estimated Value
Home Financials for this Owner
Home Financials are based on the most recent Mortgage that was taken out on this home.
Original Mortgage
$77,838
Outstanding Balance
$43,477
Interest Rate
4.04%
Mortgage Type
FHA
Estimated Equity
$192,296
Purchase Details
Closed on
Jan 14, 2005
Sold by
Curl Brenda Joyce
Bought by
Ann Seals Thelma
Home Financials for this Owner
Home Financials are based on the most recent Mortgage that was taken out on this home.
Original Mortgage
$78,800
Interest Rate
5.62%
Purchase Details
Closed on
Apr 9, 1998
Sold by
Simerly Martha
Bought by
Curl Brenda
Purchase Details
Closed on
Jan 24, 1995
Sold by
Jinks Johnnie Claude
Bought by
Simerly Martha
Purchase Details
Closed on
Dec 1, 1959
Bought by
Jinks Johnnie Claude and Jinks Dorothy
Create a Home Valuation Report for This Property
The Home Valuation Report is an in-depth analysis detailing your home's value as well as a comparison with similar homes in the area
Home Values in the Area
Average Home Value in this Area
Purchase History
| Date | Buyer | Sale Price | Title Company |
|---|---|---|---|
| Seals Scottie D | -- | None Available | |
| Ann Seals Thelma | $74,000 | -- | |
| Curl Brenda | $48,000 | -- | |
| Simerly Martha | $53,000 | -- | |
| Jinks Johnnie Claude | -- | -- |
Source: Public Records
Mortgage History
| Date | Status | Borrower | Loan Amount |
|---|---|---|---|
| Open | Seals Scottie D | $77,838 | |
| Closed | Jinks Johnnie Claude | $78,800 |
Source: Public Records
Tax History
| Year | Tax Paid | Tax Assessment Tax Assessment Total Assessment is a certain percentage of the fair market value that is determined by local assessors to be the total taxable value of land and additions on the property. | Land | Improvement |
|---|---|---|---|---|
| 2025 | $703 | $53,700 | $8,775 | $44,925 |
| 2024 | $500 | $28,400 | $7,025 | $21,375 |
| 2023 | $500 | $28,400 | $0 | $0 |
| 2022 | $898 | $28,400 | $7,025 | $21,375 |
| 2021 | $898 | $28,400 | $7,025 | $21,375 |
| 2020 | $896 | $28,400 | $7,025 | $21,375 |
| 2019 | $705 | $20,725 | $6,175 | $14,550 |
| 2018 | $653 | $20,725 | $6,175 | $14,550 |
| 2017 | $643 | $20,725 | $6,175 | $14,550 |
| 2016 | $614 | $20,725 | $6,175 | $14,550 |
| 2015 | $571 | $20,725 | $6,175 | $14,550 |
| 2014 | -- | $20,725 | $6,175 | $14,550 |
| 2013 | -- | $22,850 | $0 | $0 |
Source: Public Records
Map
Nearby Homes
- 411 Ash St
- 437 Hale Ave
- 460 Ash St
- 1932 Eastern Ave
- 508 Hale Ave
- 333 S Park Ave
- 1873 Hugh Dr
- 0 S Liberty Hill Rd Unit 703697
- 106 King Ave
- 510 S Liberty Hill Rd
- 1848 Russell St
- 1821 Russell St
- 1900 Chestnut Ave
- 2225 Magnolia Ave
- 734 Seymour St
- 742 Seymour St
- 915 Forgey Ave
- 1205 Ledford Ave
- 616 N Haun Dr
- 712 Williams St
Your Personal Tour Guide
Ask me questions while you tour the home.