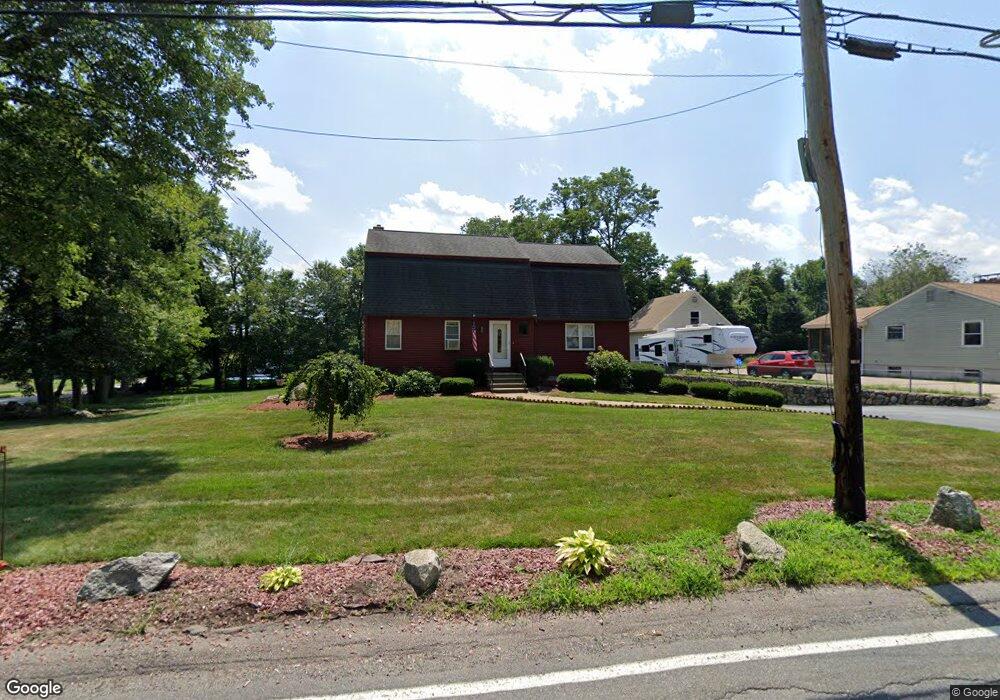
233 Lincoln St Blackstone, MA 01504
Estimated Value: $518,574 - $558,000
3
Beds
3
Baths
1,776
Sq Ft
$301/Sq Ft
Est. Value
About This Home
This home is located at 233 Lincoln St, Blackstone, MA 01504 and is currently estimated at $534,394, approximately $300 per square foot. 233 Lincoln St is a home located in Worcester County with nearby schools including Blackstone-Millville Regional High School, Founders Academy, and Beacon Charter School.
Ownership History
Date
Name
Owned For
Owner Type
Purchase Details
Closed on
May 28, 2025
Sold by
Felton Charles F and Felton Wendy A
Bought by
Felton Charles F and Felton Wendy A
Current Estimated Value
Purchase Details
Closed on
Jun 23, 2011
Sold by
Staples Timothy E and Steoles Kelly A
Bought by
Felton Charles F and Felton Wendy A
Home Financials for this Owner
Home Financials are based on the most recent Mortgage that was taken out on this home.
Original Mortgage
$245,123
Interest Rate
4.37%
Mortgage Type
FHA
Purchase Details
Closed on
Jun 9, 2009
Sold by
Millville Dev Corp
Bought by
Staples Timothy E and Staples Kelly A
Purchase Details
Closed on
Apr 28, 1995
Sold by
Maloney Kay L
Bought by
Staples Timothy and Staples Kelly
Purchase Details
Closed on
Feb 2, 1994
Sold by
Maloney Dennis M and Maloney Kay L
Bought by
Maloney Kay L
Create a Home Valuation Report for This Property
The Home Valuation Report is an in-depth analysis detailing your home's value as well as a comparison with similar homes in the area
Home Values in the Area
Average Home Value in this Area
Purchase History
| Date | Buyer | Sale Price | Title Company |
|---|---|---|---|
| Felton Charles F | -- | None Available | |
| Felton Charles F | -- | None Available | |
| Felton Charles F | $251,500 | -- | |
| Staples Timothy E | -- | -- | |
| Staples Timothy E | -- | -- | |
| Staples Timothy | $138,000 | -- | |
| Staples Timothy | $138,000 | -- | |
| Maloney Kay L | $8,000 | -- | |
| Maloney Kay L | $8,000 | -- |
Source: Public Records
Mortgage History
| Date | Status | Borrower | Loan Amount |
|---|---|---|---|
| Previous Owner | Felton Charles F | $245,123 | |
| Previous Owner | Maloney Kay L | $132,000 |
Source: Public Records
Tax History Compared to Growth
Tax History
| Year | Tax Paid | Tax Assessment Tax Assessment Total Assessment is a certain percentage of the fair market value that is determined by local assessors to be the total taxable value of land and additions on the property. | Land | Improvement |
|---|---|---|---|---|
| 2025 | $6,452 | $427,300 | $146,000 | $281,300 |
| 2024 | $6,282 | $384,700 | $153,400 | $231,300 |
| 2023 | $5,966 | $368,700 | $153,400 | $215,300 |
| 2022 | $5,350 | $298,900 | $139,700 | $159,200 |
| 2021 | $4,976 | $265,800 | $127,000 | $138,800 |
| 2020 | $5,185 | $274,900 | $127,200 | $147,700 |
| 2019 | $3,791 | $264,600 | $116,900 | $147,700 |
| 2018 | $4,707 | $241,500 | $111,300 | $130,200 |
| 2017 | $4,715 | $244,800 | $111,300 | $133,500 |
| 2016 | $4,535 | $234,500 | $102,500 | $132,000 |
| 2015 | $4,362 | $223,900 | $102,500 | $121,400 |
Source: Public Records
Map
Nearby Homes
- 302 Main St
- 0 Main St
- 259 Main St
- 6 Old Mendon St
- 122 Canal St
- 96 Main St Unit 1
- 183-183R Mendon St
- 1 Tupperware Dr Unit 138
- 1 Tupperware Dr Unit 108
- 1 Tupperware Dr Unit 326
- 1 Tupperware Dr Unit 226
- 1 Tupperware Dr Unit 209
- 15 Blackstone St
- 41 Thayer St
- 162 Blackstone St
- 24 Ascension St
- 22 Colerick Ave
- 10 Autumn Ln
- 81 Fountain St
- 6 Mill St
- 235 Lincoln St
- 236 Lincoln St
- 234 Lincoln St
- 229 Lincoln St
- 238 Lincoln St
- 232 Lincoln St
- 237 Lincoln St
- 12 Mandy Dr
- 10 Mandy Dr
- 227 Lincoln St
- 240 Lincoln St
- 230 Lincoln St
- 239 Lincoln St
- 8 Mandy Dr
- 242 Lincoln St
- 1 Chad Michael Ct
- 225 Lincoln St
- lots Old Lincoln St
- parcel Old Lincoln St
- 241 Lincoln St