
Seller's Agent in 2018
Patrick French
Better Properties Gig Harbor
(360) 774-0620
26 Total Sales


Estimated Value: $560,000 - $621,000
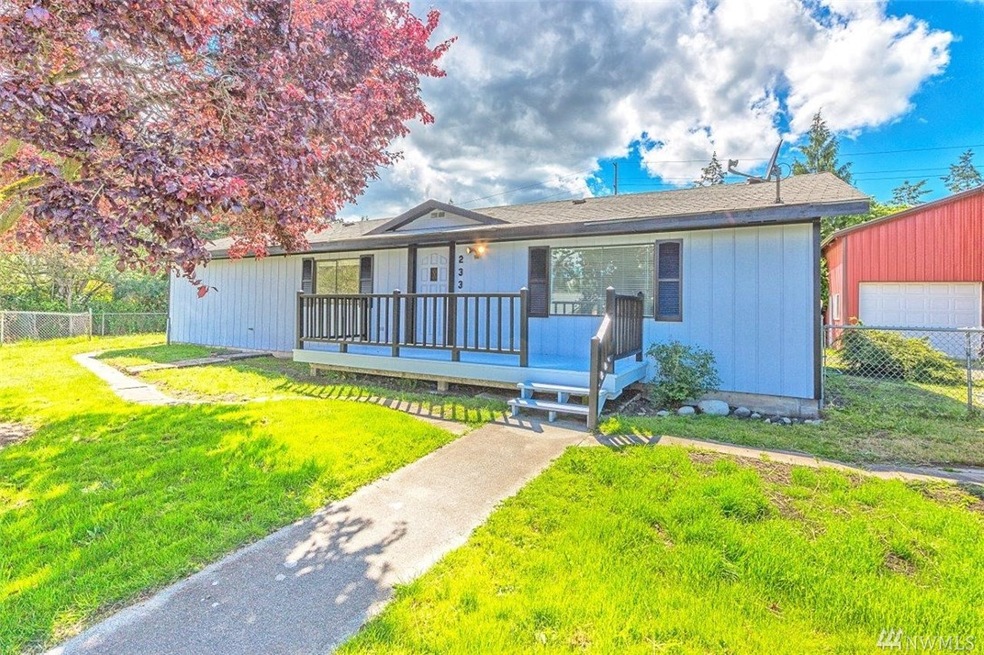
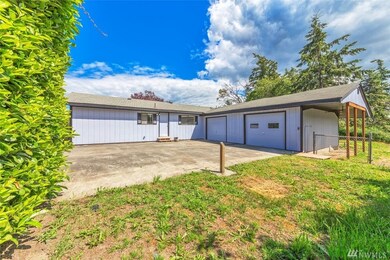
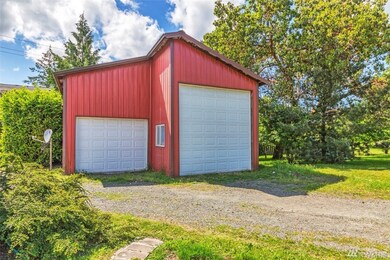
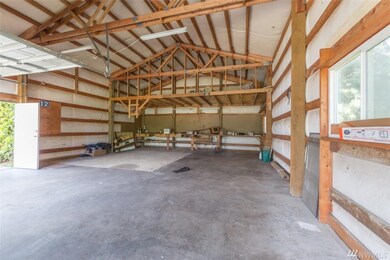
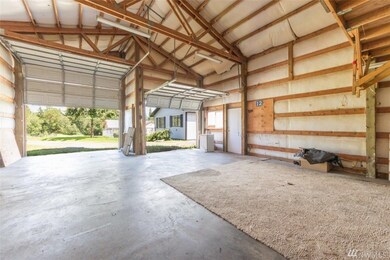
Great rambler in a great location! This large double lot is walking distance to bus lines, shopping and restaurants! Huge shop for RV, mechanic, woodworker or whatever your hobbies may be! Kitchen features new countertops and stainless appliances. New carpet throughout and fresh interior and exterior paint. Master bedroom features private bath and slider to newly built deck. Move in ready!!
Last Agent to Sell the Property
Better Properties Gig Harbor License #108808 Listed on: 06/21/2018
Last Buyer's Agent
Richard Hild
John L. Scott Port Townsend License #6036
Source: Northwest Multiple Listing Service (NWMLS)
MLS#: NWM1315312
| Date | Buyer | Sale Price | Title Company |
|---|---|---|---|
| Kelly Kenneth F | -- | None Available | |
| Kelly Kenneth | $315,000 | Jefferson Title Co Inc |
| Date | Event | Price | Change | Sq Ft Price |
|---|---|---|---|---|
| 07/02/2018 07/02/18 | Sold | $315,000 | 0.0% | $243 / Sq Ft |
| 06/23/2018 06/23/18 | Pending | -- | -- | -- |
| 06/21/2018 06/21/18 | For Sale | $315,000 | -- | $243 / Sq Ft |
| Year | Tax Paid | Tax Assessment Tax Assessment Total Assessment is a certain percentage of the fair market value that is determined by local assessors to be the total taxable value of land and additions on the property. | Land | Improvement |
|---|---|---|---|---|
| 2024 | $4,472 | $526,617 | $169,848 | $356,769 |
| 2023 | $4,472 | $498,017 | $156,760 | $341,257 |
| 2022 | $3,700 | $478,377 | $137,120 | $341,257 |
| 2021 | $3,425 | $381,202 | $89,530 | $291,672 |
| 2020 | $3,232 | $340,285 | $78,786 | $261,499 |
| 2019 | $2,726 | $313,008 | $71,624 | $241,384 |
| 2018 | $2,991 | $286,801 | $71,624 | $215,177 |
| 2017 | $2,582 | $275,128 | $67,124 | $208,004 |
| 2016 | $2,202 | $253,610 | $67,124 | $186,486 |
| 2015 | $2,147 | $224,920 | $67,124 | $157,796 |
| 2014 | -- | $217,748 | $67,124 | $150,624 |
| 2013 | -- | $207,380 | $63,930 | $143,450 |
Seller's Agent in 2018
Patrick French
Better Properties Gig Harbor
(360) 774-0620
26 Total Sales
R
Buyer's Agent in 2018
Richard Hild
John L. Scott Port Townsend
Source: Northwest Multiple Listing Service (NWMLS)
MLS Number: NWM1315312
APN: 948328601
Disclaimer: Certain information contained herein is derived from information provided by parties other than Homes.com. All information provided is deemed reliable, but is not guaranteed to be accurate and should be independently verified.
![]() All data is obtained from various sources and may not have been verified by broker or MLS GRID. Supplied Open House Information is subject to change without notice. All information should be independently reviewed and verified for accuracy. Properties may or may not be listed by the office/agent presenting the information. Listing information is provided by the Northwest Multiple Listing Service (NWMLS). Property information is based on available data that may include MLS information, county records, and other sources. Listings marked with the 3 tree icon and provided by NWMLS. All properties are subject to prior sale or withdrawal. IDX information is provided exclusively for consumers’ personal noncommercial use, that it may not be used for any purpose other than to identify prospective properties consumers may be interested in purchasing, that the data is deemed reliable but is not guaranteed by MLS GRID. ©2025 NWMLS.
All data is obtained from various sources and may not have been verified by broker or MLS GRID. Supplied Open House Information is subject to change without notice. All information should be independently reviewed and verified for accuracy. Properties may or may not be listed by the office/agent presenting the information. Listing information is provided by the Northwest Multiple Listing Service (NWMLS). Property information is based on available data that may include MLS information, county records, and other sources. Listings marked with the 3 tree icon and provided by NWMLS. All properties are subject to prior sale or withdrawal. IDX information is provided exclusively for consumers’ personal noncommercial use, that it may not be used for any purpose other than to identify prospective properties consumers may be interested in purchasing, that the data is deemed reliable but is not guaranteed by MLS GRID. ©2025 NWMLS.
Based on information submitted to the MLS GRID