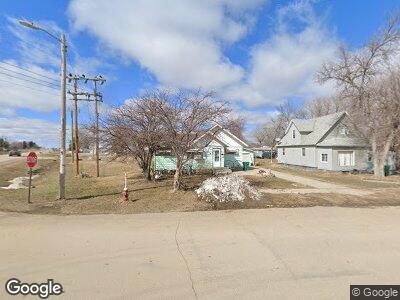
233 Main Ave S Fessenden, ND 58438
Estimated Value: $82,000 - $98,000
2
Beds
1
Bath
1,100
Sq Ft
$81/Sq Ft
Est. Value
About This Home
This home is located at 233 Main Ave S, Fessenden, ND 58438 and is currently estimated at $88,667, approximately $80 per square foot. 233 Main Ave S is a home located in Wells County with nearby schools including Fessenden-Bowdon Elementary School and Fessenden-Bowdon High School.
Ownership History
Date
Name
Owned For
Owner Type
Purchase Details
Closed on
Jul 23, 2024
Sold by
Vantonder Raymond A and Vantonder Mavis J
Bought by
Huber Mark L
Current Estimated Value
Home Financials for this Owner
Home Financials are based on the most recent Mortgage that was taken out on this home.
Original Mortgage
$69,840
Outstanding Balance
$68,613
Interest Rate
0.68%
Mortgage Type
Construction
Estimated Equity
$67,387
Purchase Details
Closed on
Jun 8, 2023
Sold by
Seibold Tammie
Bought by
Vantonder Raymond A
Purchase Details
Closed on
May 17, 2016
Sold by
Evans Mark A and Evans Deanna L
Bought by
Evans Mark A and Evans Deanna L
Home Financials for this Owner
Home Financials are based on the most recent Mortgage that was taken out on this home.
Original Mortgage
$10,000
Interest Rate
3.59%
Mortgage Type
New Conventional
Create a Home Valuation Report for This Property
The Home Valuation Report is an in-depth analysis detailing your home's value as well as a comparison with similar homes in the area
Home Values in the Area
Average Home Value in this Area
Purchase History
| Date | Buyer | Sale Price | Title Company |
|---|---|---|---|
| Huber Mark L | $90,000 | Bismarck Title | |
| Vantonder Raymond A | $566 | -- | |
| Evans Mark A | $10,000 | -- |
Source: Public Records
Mortgage History
| Date | Status | Borrower | Loan Amount |
|---|---|---|---|
| Open | Huber Mark L | $69,840 | |
| Previous Owner | Evans Mark A | $10,000 |
Source: Public Records
Tax History Compared to Growth
Tax History
| Year | Tax Paid | Tax Assessment Tax Assessment Total Assessment is a certain percentage of the fair market value that is determined by local assessors to be the total taxable value of land and additions on the property. | Land | Improvement |
|---|---|---|---|---|
| 2024 | $50 | $33,430 | $6,100 | $27,330 |
| 2023 | $480 | $29,010 | $6,100 | $22,910 |
| 2022 | $460 | $29,010 | $6,100 | $22,910 |
| 2021 | $419 | $25,660 | $2,160 | $23,500 |
| 2020 | $428 | $25,660 | $2,160 | $23,500 |
| 2019 | $447 | $25,490 | $1,990 | $23,500 |
| 2018 | $435 | $25,490 | $1,990 | $23,500 |
| 2017 | $435 | $25,490 | $1,990 | $23,500 |
| 2016 | $400 | $25,490 | $1,990 | $23,500 |
| 2015 | $336 | $25,490 | $1,990 | $23,500 |
| 2014 | $279 | $22,640 | $1,990 | $20,650 |
| 2013 | $279 | $18,090 | $1,590 | $16,500 |
Source: Public Records
Map
Nearby Homes
- 412 2nd St S
- 128 Main Ave S
- XXX 1st St S
- 200 1st St S
- 414 2nd St N
- 5258 14th St NE
- 2380 37th G St Unit Antelope Lake, Anamo
- 4270 29th St NE
- 530 Harvey Ave
- 204 Kennedy Ave
- 532 Pleasant St
- 405 Emerson Ave
- 1611 Dunn Dr
- 516 Desmet Ave
- 400 N Saint E
- 1513 Advent St
- 402 Brewster St E
- 905 Adams Ave
- 516 Alder Ave
- 708 Birch Ave