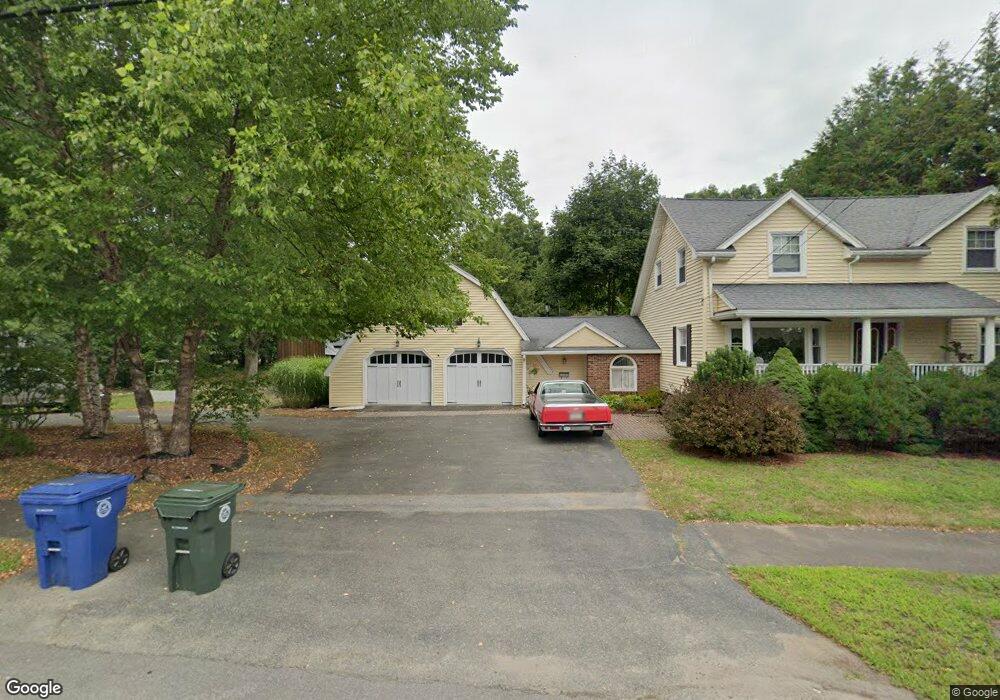
233 Maple St Danvers, MA 01923
Estimated Value: $767,000 - $1,080,000
3
Beds
3
Baths
2,480
Sq Ft
$366/Sq Ft
Est. Value
About This Home
This home is located at 233 Maple St, Danvers, MA 01923 and is currently estimated at $906,796, approximately $365 per square foot. 233 Maple St is a home located in Essex County with nearby schools including Danvers High School, St. Mary of the Annunciation School, and St. John's Prep.
Ownership History
Date
Name
Owned For
Owner Type
Purchase Details
Closed on
Sep 1, 2022
Sold by
Shultz Brian J and Desanctis Joyce R
Bought by
Shultz Desanctis Lt and Shultz
Current Estimated Value
Purchase Details
Closed on
Mar 31, 2008
Sold by
Kalantzis John
Bought by
Shultz Brian J and Desanctis Joyce R
Home Financials for this Owner
Home Financials are based on the most recent Mortgage that was taken out on this home.
Original Mortgage
$417,000
Interest Rate
5.76%
Mortgage Type
Purchase Money Mortgage
Purchase Details
Closed on
Jul 14, 2006
Sold by
Janes Dianne D Est and Rockett
Bought by
Kalantzis John
Purchase Details
Closed on
Jul 15, 1999
Sold by
Sabino Roy and Sabino Janett
Bought by
Janes Richard D and Janes Dianne D
Create a Home Valuation Report for This Property
The Home Valuation Report is an in-depth analysis detailing your home's value as well as a comparison with similar homes in the area
Home Values in the Area
Average Home Value in this Area
Purchase History
| Date | Buyer | Sale Price | Title Company |
|---|---|---|---|
| Shultz Desanctis Lt | -- | None Available | |
| Shultz Brian J | $522,350 | -- | |
| Kalantzis John | $393,400 | -- | |
| Janes Richard D | $280,000 | -- |
Source: Public Records
Mortgage History
| Date | Status | Borrower | Loan Amount |
|---|---|---|---|
| Previous Owner | Janes Richard D | $371,000 | |
| Previous Owner | Janes Richard D | $417,000 | |
| Previous Owner | Janes Richard D | $448,000 |
Source: Public Records
Tax History Compared to Growth
Tax History
| Year | Tax Paid | Tax Assessment Tax Assessment Total Assessment is a certain percentage of the fair market value that is determined by local assessors to be the total taxable value of land and additions on the property. | Land | Improvement |
|---|---|---|---|---|
| 2025 | $7,914 | $720,100 | $364,600 | $355,500 |
| 2024 | $7,721 | $695,000 | $364,600 | $330,400 |
| 2023 | $7,257 | $617,600 | $323,500 | $294,100 |
| 2022 | $7,047 | $556,600 | $283,000 | $273,600 |
| 2021 | $6,666 | $499,300 | $257,300 | $242,000 |
| 2020 | $6,936 | $531,100 | $249,200 | $281,900 |
| 2019 | $7,032 | $529,500 | $241,100 | $288,400 |
| 2018 | $6,626 | $489,400 | $234,400 | $255,000 |
| 2017 | $6,591 | $464,500 | $218,200 | $246,300 |
| 2016 | $6,369 | $448,500 | $208,700 | $239,800 |
| 2015 | $6,094 | $408,700 | $181,700 | $227,000 |
Source: Public Records
Map
Nearby Homes
- 39 Roosevelt Ave
- 6 Kimberly Dr
- 11 Spring St
- 4 Butler Ave
- 14 Williams St Unit C17
- 35 Locust St Unit 3
- 12 Central Ave Unit 1
- 35 High St Unit 3D
- 22 Collins St Unit 31
- 38 High St Unit 4
- 57 Adams St
- 42 Coolidge Rd
- 12 Exeter St
- 4 Briarwood Dr
- 63 Adams St
- 78 North St
- 11 Riverside Ave Unit 111
- 4 Chatham Ln
- 320 Newbury St Unit 304
- 7 Riverbank Ave Unit 7