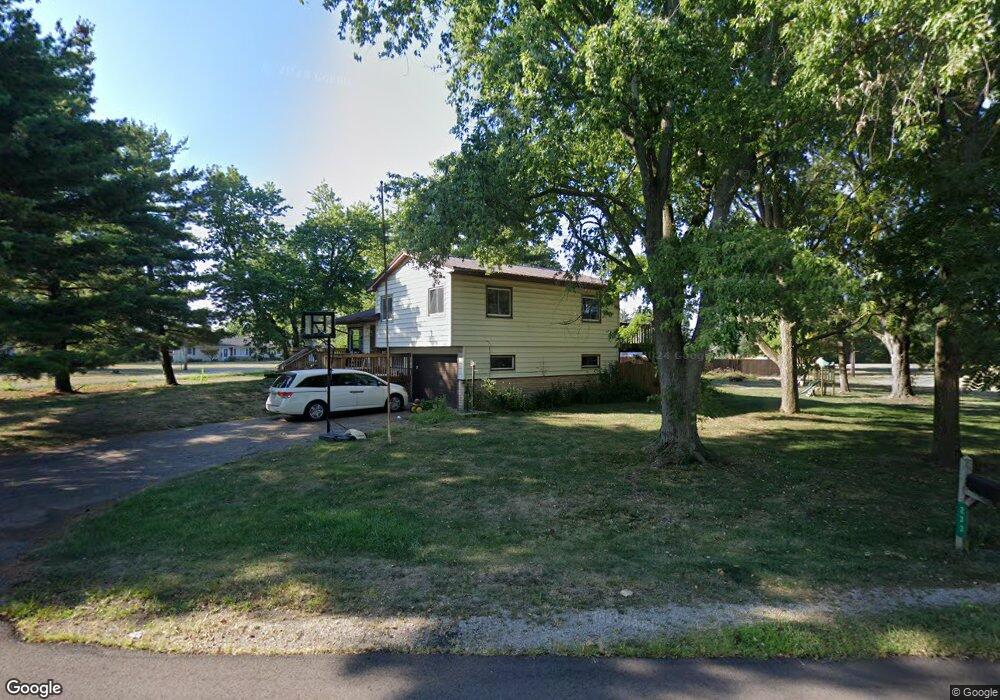
233 Monticello St Circleville, OH 43113
Estimated Value: $250,000 - $262,000
3
Beds
2
Baths
1,486
Sq Ft
$173/Sq Ft
Est. Value
About This Home
This home is located at 233 Monticello St, Circleville, OH 43113 and is currently estimated at $257,667, approximately $173 per square foot. 233 Monticello St is a home located in Pickaway County with nearby schools including Logan Elm High School and Crossroads Christian Academy.
Ownership History
Date
Name
Owned For
Owner Type
Purchase Details
Closed on
Jun 12, 2017
Sold by
Radcliff Teresa L and Johnson Teresa L
Bought by
Marshall James and Marshall Kelsey
Current Estimated Value
Home Financials for this Owner
Home Financials are based on the most recent Mortgage that was taken out on this home.
Original Mortgage
$122,244
Outstanding Balance
$103,958
Interest Rate
4.87%
Mortgage Type
FHA
Estimated Equity
$153,709
Purchase Details
Closed on
Apr 3, 2009
Sold by
Johnson Rocky S
Bought by
Radabaugh Teresa L and Radcliff Teresa L
Home Financials for this Owner
Home Financials are based on the most recent Mortgage that was taken out on this home.
Original Mortgage
$74,600
Interest Rate
5.05%
Mortgage Type
New Conventional
Purchase Details
Closed on
May 6, 1992
Sold by
Radcliff Reginald P
Bought by
Radcliff Teresa L
Purchase Details
Closed on
May 1, 1985
Create a Home Valuation Report for This Property
The Home Valuation Report is an in-depth analysis detailing your home's value as well as a comparison with similar homes in the area
Home Values in the Area
Average Home Value in this Area
Purchase History
| Date | Buyer | Sale Price | Title Company |
|---|---|---|---|
| Marshall James | $124,500 | Attorney | |
| Radabaugh Teresa L | -- | Title First | |
| Radcliff Teresa L | -- | -- | |
| -- | $54,900 | -- |
Source: Public Records
Mortgage History
| Date | Status | Borrower | Loan Amount |
|---|---|---|---|
| Open | Marshall James | $122,244 | |
| Previous Owner | Radabaugh Teresa L | $74,600 |
Source: Public Records
Tax History Compared to Growth
Tax History
| Year | Tax Paid | Tax Assessment Tax Assessment Total Assessment is a certain percentage of the fair market value that is determined by local assessors to be the total taxable value of land and additions on the property. | Land | Improvement |
|---|---|---|---|---|
| 2024 | -- | $67,670 | $10,770 | $56,900 |
| 2023 | $2,220 | $67,670 | $10,770 | $56,900 |
| 2022 | $1,643 | $46,920 | $9,070 | $37,850 |
| 2021 | $1,686 | $46,920 | $9,070 | $37,850 |
| 2020 | $1,708 | $46,920 | $9,070 | $37,850 |
| 2019 | $1,322 | $38,800 | $9,070 | $29,730 |
| 2018 | $1,508 | $38,800 | $9,070 | $29,730 |
| 2017 | $1,234 | $38,800 | $9,070 | $29,730 |
| 2016 | $1,212 | $38,470 | $9,180 | $29,290 |
| 2015 | $917 | $38,470 | $9,180 | $29,290 |
| 2014 | $2,719 | $38,470 | $9,180 | $29,290 |
| 2013 | $1,981 | $39,930 | $9,180 | $30,750 |
Source: Public Records
Map
Nearby Homes
- 0 Monticello St
- 311 Tarlton Rd
- 331 Tarlton Rd
- 25460 Us Highway 23 S
- 355 Cherokee Dr
- 363 Logan St
- 1031 S Washington St
- 373 Walnut St Unit REAR
- 160 Logan St
- 339 Walnut St
- 1002 S Court St
- 705 Clinton St
- 417 Half Ave
- 429 Half Ave
- 546 E Ohio St
- 614 Renick Ave
- 615 S Court St
- 474 Half Ave
- 575 Renick Ave
- 128 W Corwin St
- 233 Monticello Rd
- 2415 Puthuff Ave
- 2410 Puthuff Ave
- 260 Shadwell Dr
- 236 Monticello Rd
- 218 Monticello Rd
- 207 Monticello Rd
- 251 Shadwell Dr
- 271 Monticello Rd
- 2263 Puthuff Ave
- 271 Shadwell Dr
- 250 Ludwig Dr
- 274 Monticello Rd
- 284 Shadwell Dr Unit 86
- 293 Monticello Rd
- 272 Ludwig Dr
- 25160 U S 23
- 289 Shadwell Dr
- 25160 Us Highway 23 S
- 25160 S Rt23