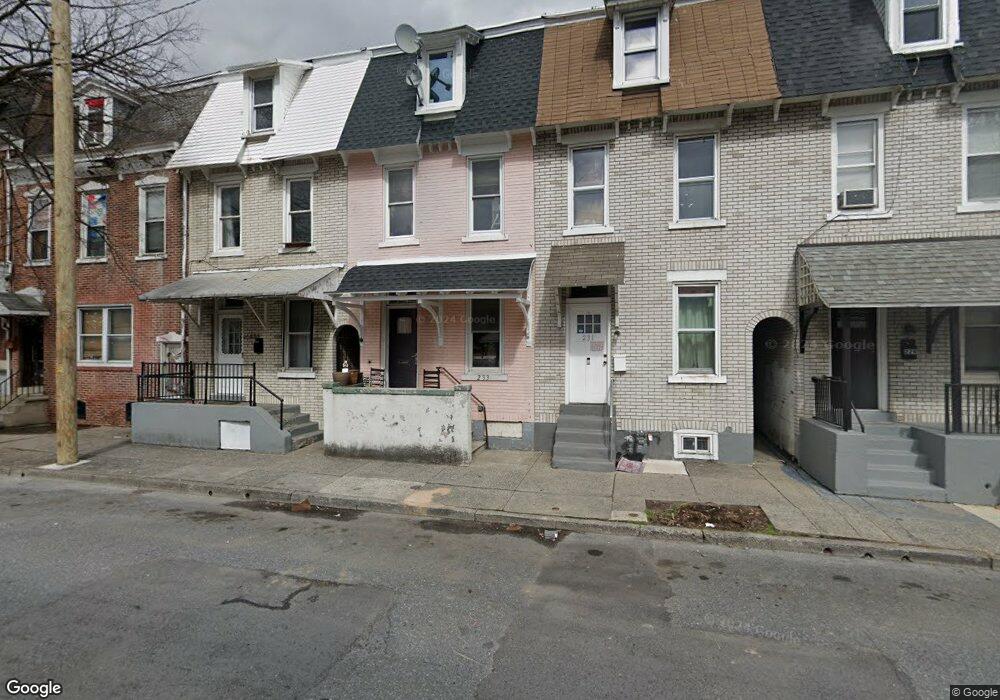
233 N 2nd St Allentown, PA 18102
1st Ward NeighborhoodEstimated Value: $194,000 - $253,000
5
Beds
1
Bath
1,890
Sq Ft
$114/Sq Ft
Est. Value
About This Home
This home is located at 233 N 2nd St, Allentown, PA 18102 and is currently estimated at $215,163, approximately $113 per square foot. 233 N 2nd St is a home located in Lehigh County with nearby schools including Sheridan Elementary School, Harrison-Morton Middle School, and Louis E. Dieruff High School.
Ownership History
Date
Name
Owned For
Owner Type
Purchase Details
Closed on
Aug 20, 2019
Sold by
Stevens Carlos D and Davis Anita
Bought by
Tyler Rea J
Current Estimated Value
Purchase Details
Closed on
Dec 18, 1987
Sold by
Binczak Jr William R
Bought by
Stevens Elouise
Purchase Details
Closed on
Jul 10, 1987
Sold by
Rehrig Roy H
Bought by
Binczak William R
Purchase Details
Closed on
Aug 23, 1986
Bought by
Rehrig Roy H
Create a Home Valuation Report for This Property
The Home Valuation Report is an in-depth analysis detailing your home's value as well as a comparison with similar homes in the area
Home Values in the Area
Average Home Value in this Area
Purchase History
| Date | Buyer | Sale Price | Title Company |
|---|---|---|---|
| Tyler Rea J | -- | None Available | |
| Stevens Elouise | $36,000 | -- | |
| Binczak William R | $17,500 | -- | |
| Rehrig Roy H | -- | -- |
Source: Public Records
Tax History Compared to Growth
Tax History
| Year | Tax Paid | Tax Assessment Tax Assessment Total Assessment is a certain percentage of the fair market value that is determined by local assessors to be the total taxable value of land and additions on the property. | Land | Improvement |
|---|---|---|---|---|
| 2025 | $2,140 | $65,300 | $6,500 | $58,800 |
| 2024 | $2,140 | $65,300 | $6,500 | $58,800 |
| 2023 | $2,140 | $65,300 | $6,500 | $58,800 |
| 2022 | $2,066 | $65,300 | $58,800 | $6,500 |
| 2021 | $2,025 | $65,300 | $6,500 | $58,800 |
| 2020 | $1,973 | $65,300 | $6,500 | $58,800 |
| 2019 | $1,941 | $65,300 | $6,500 | $58,800 |
| 2018 | $1,809 | $65,300 | $6,500 | $58,800 |
| 2017 | $1,763 | $65,300 | $6,500 | $58,800 |
| 2016 | -- | $65,300 | $6,500 | $58,800 |
| 2015 | -- | $65,300 | $6,500 | $58,800 |
| 2014 | -- | $65,300 | $6,500 | $58,800 |
Source: Public Records
Map
Nearby Homes
- 182 W Chew St
- 213 W Chew St
- 217 N Grant St
- 127 N Bryan St
- 137 N 3rd St
- 201 Ridge Ave
- 172 Chestnut St
- 408 N 2nd St
- 336 N Limestone St
- 418 Spruce St
- 222 N Front St
- 30 N 2nd St Unit 2
- 308 W Liberty St
- 215 W Liberty St
- 414 N Front St
- 516 N 2nd St
- 384 W Gordon St
- 201 N 4th St
- 418 N Jordan St
- 611 N Limestone St