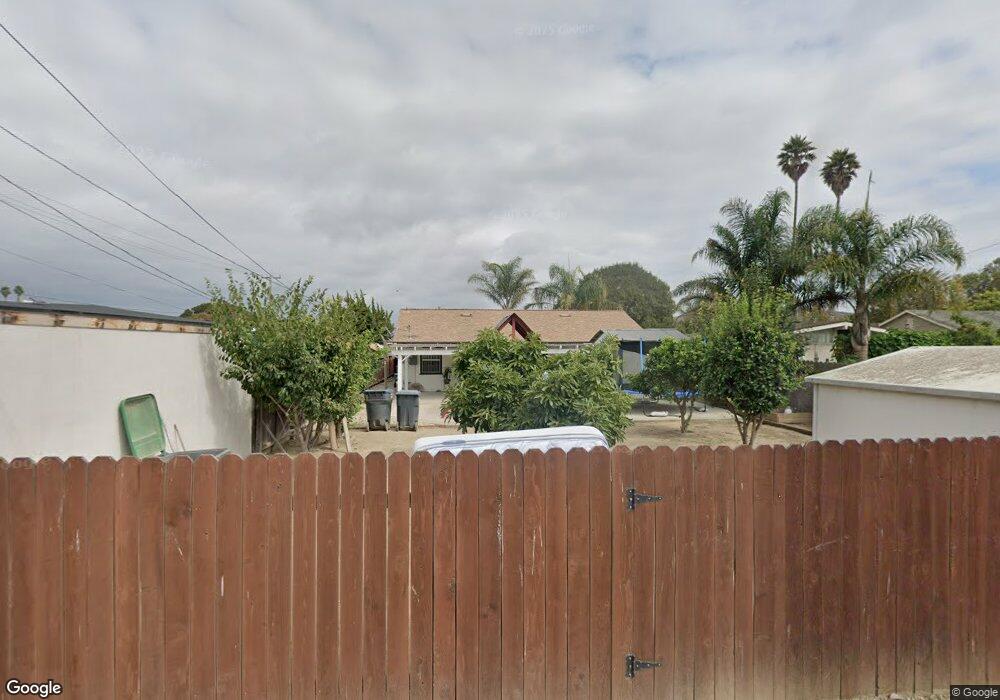
233 N M St Lompoc, CA 93436
Estimated Value: $453,301 - $535,000
3
Beds
2
Baths
1,061
Sq Ft
$473/Sq Ft
Est. Value
About This Home
This home is located at 233 N M St, Lompoc, CA 93436 and is currently estimated at $502,325, approximately $473 per square foot. 233 N M St is a home located in Santa Barbara County with nearby schools including Miguelito Elementary School, Lompoc Valley Middle School, and Lompoc High School.
Ownership History
Date
Name
Owned For
Owner Type
Purchase Details
Closed on
Oct 1, 2024
Sold by
Ceron Guillermo G and Ceron Lizbeth Del
Bought by
Guillermo G Ceron And Lizbeth Del Socorro Cer and Ceron
Current Estimated Value
Purchase Details
Closed on
Sep 4, 2013
Sold by
Nunez Margarita H
Bought by
Nunez Juan Hernandez
Home Financials for this Owner
Home Financials are based on the most recent Mortgage that was taken out on this home.
Original Mortgage
$201,465
Interest Rate
4.25%
Mortgage Type
FHA
Purchase Details
Closed on
Sep 3, 2013
Sold by
Nunez Juan Hernandez
Bought by
Ceron Guillermo G and Ceron Lizbeth P
Home Financials for this Owner
Home Financials are based on the most recent Mortgage that was taken out on this home.
Original Mortgage
$201,465
Interest Rate
4.25%
Mortgage Type
FHA
Purchase Details
Closed on
Jul 9, 2012
Sold by
Carpenter Robert F and Carpenter Michelle R
Bought by
Nunez Juan Hernandez and Nunez Margarita H
Purchase Details
Closed on
Mar 7, 2002
Sold by
Eden Mike Wayne and Eden Kelle Ann
Bought by
Carpenter Robert F and Carpenter Michelle R
Home Financials for this Owner
Home Financials are based on the most recent Mortgage that was taken out on this home.
Original Mortgage
$180,162
Interest Rate
6.85%
Mortgage Type
FHA
Purchase Details
Closed on
Mar 1, 2001
Sold by
Thielst Walle and Thielst Verda M
Bought by
Eden Mike Wayne and Eden Kelle Ann
Home Financials for this Owner
Home Financials are based on the most recent Mortgage that was taken out on this home.
Original Mortgage
$118,000
Interest Rate
6.97%
Create a Home Valuation Report for This Property
The Home Valuation Report is an in-depth analysis detailing your home's value as well as a comparison with similar homes in the area
Home Values in the Area
Average Home Value in this Area
Purchase History
| Date | Buyer | Sale Price | Title Company |
|---|---|---|---|
| Guillermo G Ceron And Lizbeth Del Socorro Cer | -- | None Listed On Document | |
| Nunez Juan Hernandez | -- | First American Title | |
| Nunez Juan Hernandez | -- | First American Title Company | |
| Ceron Guillermo G | $223,000 | First American Title Company | |
| Nunez Juan Hernandez | $134,000 | Fidelity National Title Co | |
| Carpenter Robert F | $183,000 | Chicago Title Co | |
| Eden Mike Wayne | -- | Chicago Title Co |
Source: Public Records
Mortgage History
| Date | Status | Borrower | Loan Amount |
|---|---|---|---|
| Previous Owner | Ceron Guillermo G | $201,465 | |
| Previous Owner | Carpenter Robert F | $180,162 | |
| Previous Owner | Eden Mike Wayne | $118,000 |
Source: Public Records
Tax History
| Year | Tax Paid | Tax Assessment Tax Assessment Total Assessment is a certain percentage of the fair market value that is determined by local assessors to be the total taxable value of land and additions on the property. | Land | Improvement |
|---|---|---|---|---|
| 2025 | $2,998 | $273,354 | $85,804 | $187,550 |
| 2023 | $2,998 | $262,741 | $82,473 | $180,268 |
| 2022 | $2,946 | $257,590 | $80,856 | $176,734 |
| 2021 | $2,978 | $252,540 | $79,271 | $173,269 |
| 2020 | $2,946 | $249,952 | $78,459 | $171,493 |
| 2019 | $2,898 | $245,052 | $76,921 | $168,131 |
| 2018 | $2,853 | $240,248 | $75,413 | $164,835 |
| 2017 | $2,801 | $235,538 | $73,935 | $161,603 |
| 2016 | $2,751 | $230,921 | $72,486 | $158,435 |
| 2014 | $2,692 | $223,000 | $70,000 | $153,000 |
Source: Public Records
Map
Nearby Homes
Your Personal Tour Guide
Ask me questions while you tour the home.