Estimated Value: $660,000 - $851,000
3
Beds
2
Baths
1,396
Sq Ft
$534/Sq Ft
Est. Value
About This Home
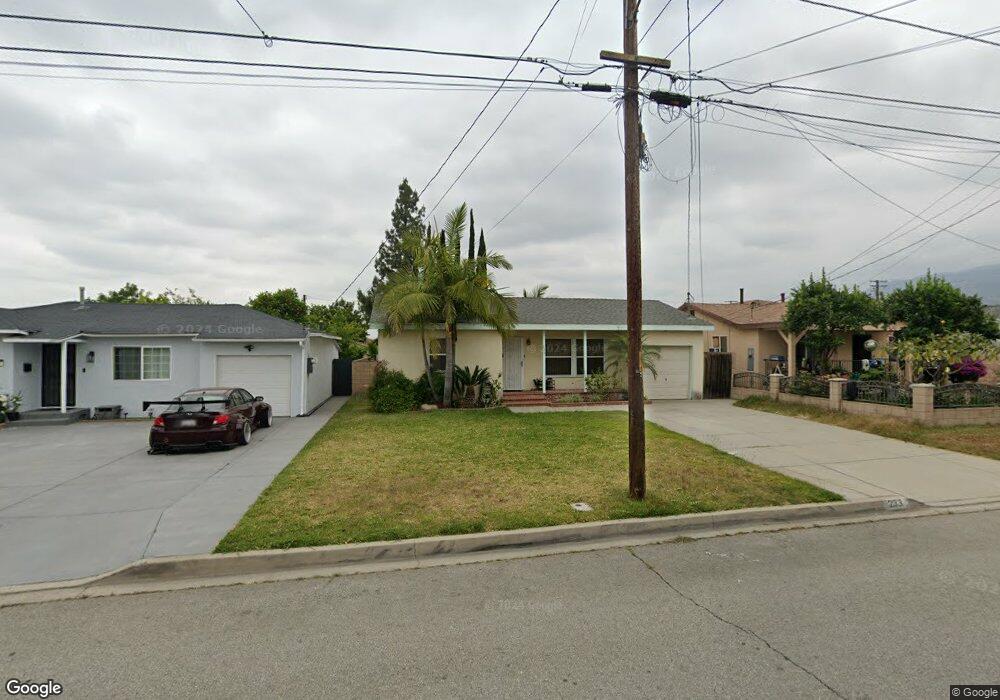
This home is located at 233 N Orange Ave, Azusa, CA 91702 and is currently estimated at $744,777, approximately $533 per square foot. 233 N Orange Ave is a home located in Los Angeles County with nearby schools including Gladstone High School, Christbridge Academy, and St. Frances of Rome School.
Ownership History
Date
Name
Owned For
Owner Type
Purchase Details
Closed on
Mar 23, 2009
Sold by
Hsbc Bank Usa National Association
Bought by
Ngo Vincent
Current Estimated Value
Home Financials for this Owner
Home Financials are based on the most recent Mortgage that was taken out on this home.
Original Mortgage
$212,800
Outstanding Balance
$135,599
Interest Rate
5.17%
Mortgage Type
Purchase Money Mortgage
Estimated Equity
$609,178
Purchase Details
Closed on
Aug 4, 2008
Sold by
Fox Gary
Bought by
Hsbc Bank Usa Na
Purchase Details
Closed on
Aug 8, 2006
Sold by
Martinez Domingo and Martinez Angelica
Bought by
Fox Gary
Home Financials for this Owner
Home Financials are based on the most recent Mortgage that was taken out on this home.
Original Mortgage
$449,100
Interest Rate
7.5%
Mortgage Type
Purchase Money Mortgage
Purchase Details
Closed on
Jan 5, 2005
Sold by
Newton Harry
Bought by
Martinez Domingo
Purchase Details
Closed on
Jan 20, 1997
Sold by
Newton Mary Lou
Bought by
Newton Mary Lou
Create a Home Valuation Report for This Property
The Home Valuation Report is an in-depth analysis detailing your home's value as well as a comparison with similar homes in the area
Home Values in the Area
Average Home Value in this Area
Purchase History
| Date | Buyer | Sale Price | Title Company |
|---|---|---|---|
| Ngo Vincent | $266,000 | Fatcola | |
| Ngo Vincent | -- | First American Title Co La | |
| Hsbc Bank Usa Na | $273,350 | None Available | |
| Fox Gary | $499,000 | Ticor Title Co Glendale | |
| Martinez Domingo | $200,000 | -- | |
| Newton Mary Lou | -- | -- |
Source: Public Records
Mortgage History
| Date | Status | Borrower | Loan Amount |
|---|---|---|---|
| Open | Ngo Vincent | $212,800 | |
| Previous Owner | Fox Gary | $449,100 |
Source: Public Records
Tax History Compared to Growth
Tax History
| Year | Tax Paid | Tax Assessment Tax Assessment Total Assessment is a certain percentage of the fair market value that is determined by local assessors to be the total taxable value of land and additions on the property. | Land | Improvement |
|---|---|---|---|---|
| 2025 | $4,342 | $342,528 | $195,217 | $147,311 |
| 2024 | $4,342 | $335,813 | $191,390 | $144,423 |
| 2023 | $4,226 | $329,230 | $187,638 | $141,592 |
| 2022 | $4,171 | $322,775 | $183,959 | $138,816 |
| 2021 | $4,063 | $316,447 | $180,352 | $136,095 |
| 2019 | $3,928 | $307,062 | $175,003 | $132,059 |
| 2018 | $3,742 | $301,042 | $171,572 | $129,470 |
| 2016 | $3,578 | $289,354 | $164,910 | $124,444 |
| 2015 | $3,518 | $285,008 | $162,433 | $122,575 |
| 2014 | $3,291 | $279,426 | $159,252 | $120,174 |
Source: Public Records
Map
Nearby Homes
- 532 W 2nd St
- 417 N Vernon Ave
- 175 N San Gabriel Ave
- 403 N San Gabriel Ave
- 227 N Azusa Ave
- 11 N San Gabriel Canyon Ave
- 932 Momax St
- 207 N Pasadena Ave
- 415 S Grandin Ave
- 248 N Rodecker Dr
- 890 E Gladstone St
- 628 N Pasadena Ave
- 433 E Mason St
- 5527 N Gareloch Ave
- 936 N Enid Ave
- 17049 E Orkney St
- 830 N Dalton Ave Unit 210
- 644 E Lee Place
- 684 E Lee Place
- 904 N Dalton Ave
- 237 N Orange Ave
- 229 N Orange Ave
- 628 W 3rd St
- 241 N Orange Ave
- 225 N Orange Ave
- 604 W 3rd St
- 642 W 3rd St
- 223 N Orange Ave
- 234 N Orange Ave
- 238 N Orange Ave
- 230 N Orange Ave
- 242 N Orange Ave
- 226 N Orange Ave
- 217 N Orange Ave
- 654 W 3rd St
- 534 W 3rd St
- 220 N Orange Ave
- 644 W 3rd St
- 216 N Orange Ave
- 518 W 3rd St