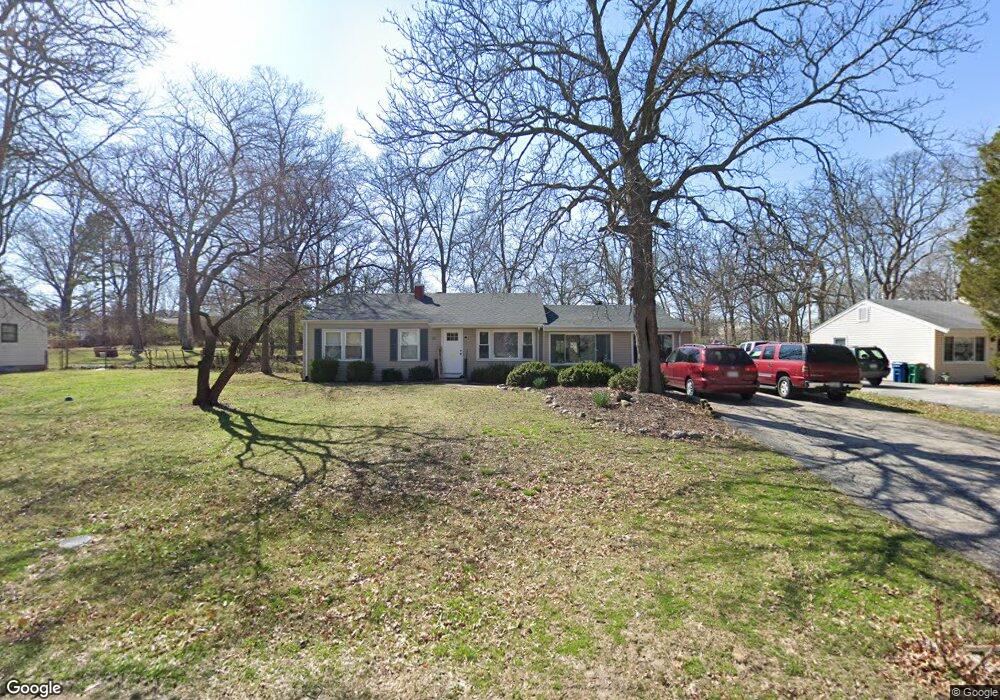
233 Nancy Place Ballwin, MO 63021
Estimated Value: $274,293 - $334,000
4
Beds
2
Baths
1,492
Sq Ft
$201/Sq Ft
Est. Value
About This Home
This home is located at 233 Nancy Place, Ballwin, MO 63021 and is currently estimated at $300,073, approximately $201 per square foot. 233 Nancy Place is a home located in St. Louis County with nearby schools including Ballwin Elementary School, Selvidge Middle School, and Marquette Sr. High School.
Ownership History
Date
Name
Owned For
Owner Type
Purchase Details
Closed on
May 5, 2006
Sold by
Investment Solutions Realty Llc
Bought by
Hall Forrest D and Hall Leah R
Current Estimated Value
Home Financials for this Owner
Home Financials are based on the most recent Mortgage that was taken out on this home.
Original Mortgage
$178,500
Outstanding Balance
$103,190
Interest Rate
6.56%
Mortgage Type
Fannie Mae Freddie Mac
Estimated Equity
$196,883
Purchase Details
Closed on
Mar 30, 2006
Sold by
Graf Richard and Graf Nancy
Bought by
Investment Solutions Realty Llc
Home Financials for this Owner
Home Financials are based on the most recent Mortgage that was taken out on this home.
Original Mortgage
$178,500
Outstanding Balance
$103,190
Interest Rate
6.56%
Mortgage Type
Fannie Mae Freddie Mac
Estimated Equity
$196,883
Purchase Details
Closed on
Nov 3, 2005
Sold by
Bettlach Roger
Bought by
Graf Richard and Graf Nancy
Create a Home Valuation Report for This Property
The Home Valuation Report is an in-depth analysis detailing your home's value as well as a comparison with similar homes in the area
Home Values in the Area
Average Home Value in this Area
Purchase History
| Date | Buyer | Sale Price | Title Company |
|---|---|---|---|
| Hall Forrest D | $178,500 | None Available | |
| Investment Solutions Realty Llc | $150,000 | Sec | |
| Graf Richard | $132,750 | None Available | |
| Bettlach Roger | $122,000 | -- |
Source: Public Records
Mortgage History
| Date | Status | Borrower | Loan Amount |
|---|---|---|---|
| Open | Hall Forrest D | $178,500 | |
| Previous Owner | Investment Solutions Realty Llc | $150,000 |
Source: Public Records
Tax History
| Year | Tax Paid | Tax Assessment Tax Assessment Total Assessment is a certain percentage of the fair market value that is determined by local assessors to be the total taxable value of land and additions on the property. | Land | Improvement |
|---|---|---|---|---|
| 2025 | $2,870 | $45,180 | $25,650 | $19,530 |
| 2024 | $2,870 | $40,870 | $21,380 | $19,490 |
| 2023 | $2,870 | $40,870 | $21,380 | $19,490 |
| 2022 | $2,662 | $35,210 | $21,380 | $13,830 |
| 2021 | $2,642 | $35,210 | $21,380 | $13,830 |
| 2020 | $2,631 | $33,420 | $17,860 | $15,560 |
| 2019 | $2,641 | $33,420 | $17,860 | $15,560 |
| 2018 | $2,269 | $27,020 | $14,060 | $12,960 |
| 2017 | $2,215 | $27,020 | $14,060 | $12,960 |
| 2016 | $2,136 | $25,050 | $9,960 | $15,090 |
| 2015 | $2,093 | $25,050 | $9,960 | $15,090 |
| 2014 | $2,352 | $27,490 | $8,700 | $18,790 |
Source: Public Records
Map
Nearby Homes
- 634 Parker Dr
- 247 Ramsey Ln
- 318 Statewood Dr
- 279 Aspen Village Dr
- 857 Village Meadow Dr
- 847 Palm Bay Dr
- 112 Shirley Ln
- 325 Fox Village Ct
- 332 Remington Way Dr
- 127 Ivy Ct
- 131 Romine Cir
- 713 Village Wood Ct
- 835 Lilybud Ct Unit 5C
- 839 Lilybud Ct Unit 5A
- 53 Log Hill Ln
- 815 Wendevy Ct Unit 16B
- 832 Wendevy Ct Unit 8B
- 400 Woodrun Dr
- 842 Wendevy Ct
- 845 Wendevy Ct Unit 12B
- 235 Nancy Place
- 231 Nancy Place
- 237 Nancy Place
- 229 Nancy Place
- 234 New Ballwin Rd
- 236 New Ballwin Rd
- 234 Nancy Place
- 232 Nancy Place
- 236 Nancy Place
- 238 New Ballwin Rd
- 232 New Ballwin Rd
- 227 Nancy Place
- 622 Nancy Place
- 238 Nancy Place
- 625 Nancy Place
- 623 Nancy Place
- 240 Nancy Place
- 233 Dennison Dr
- 235 Dennison Dr
Your Personal Tour Guide
Ask me questions while you tour the home.