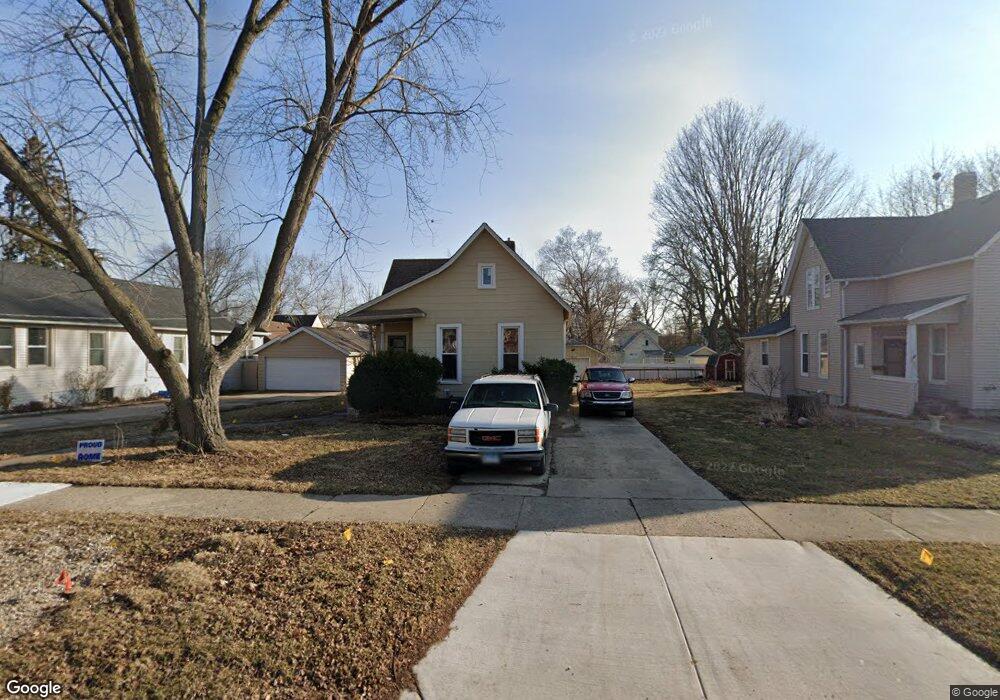
233 Orange St Elgin, IL 60123
Southwest Elgin NeighborhoodEstimated Value: $214,000 - $239,000
2
Beds
1
Bath
990
Sq Ft
$229/Sq Ft
Est. Value
About This Home
This home is located at 233 Orange St, Elgin, IL 60123 and is currently estimated at $226,618, approximately $228 per square foot. 233 Orange St is a home located in Kane County with nearby schools including Lowrie Elementary School, Abbott Middle School, and Larkin High School.
Ownership History
Date
Name
Owned For
Owner Type
Purchase Details
Closed on
May 22, 2003
Sold by
Ochoa Mike L and Ochoa Alex
Bought by
Ochoa Mike L
Current Estimated Value
Home Financials for this Owner
Home Financials are based on the most recent Mortgage that was taken out on this home.
Original Mortgage
$120,000
Outstanding Balance
$52,116
Interest Rate
5.78%
Mortgage Type
Purchase Money Mortgage
Estimated Equity
$174,502
Purchase Details
Closed on
Jun 19, 1997
Sold by
Morales Richard and Morales Mirella
Bought by
Ochoa Mike L and Ochoa Alex
Home Financials for this Owner
Home Financials are based on the most recent Mortgage that was taken out on this home.
Original Mortgage
$109,250
Interest Rate
8.01%
Purchase Details
Closed on
Jul 15, 1994
Sold by
Evers Joseph and Evers Jacalyn
Bought by
Morales Richard R and Morales Mirella
Home Financials for this Owner
Home Financials are based on the most recent Mortgage that was taken out on this home.
Original Mortgage
$88,800
Interest Rate
8.6%
Create a Home Valuation Report for This Property
The Home Valuation Report is an in-depth analysis detailing your home's value as well as a comparison with similar homes in the area
Home Values in the Area
Average Home Value in this Area
Purchase History
| Date | Buyer | Sale Price | Title Company |
|---|---|---|---|
| Ochoa Mike L | -- | -- | |
| Ochoa Mike L | $115,000 | -- | |
| Morales Richard R | $93,500 | Chicago Title Insurance Co |
Source: Public Records
Mortgage History
| Date | Status | Borrower | Loan Amount |
|---|---|---|---|
| Open | Ochoa Mike L | $120,000 | |
| Closed | Ochoa Mike L | $109,250 | |
| Previous Owner | Morales Richard R | $88,800 |
Source: Public Records
Tax History
| Year | Tax Paid | Tax Assessment Tax Assessment Total Assessment is a certain percentage of the fair market value that is determined by local assessors to be the total taxable value of land and additions on the property. | Land | Improvement |
|---|---|---|---|---|
| 2024 | $3,954 | $57,407 | $14,313 | $43,094 |
| 2023 | $3,739 | $51,863 | $12,931 | $38,932 |
| 2022 | $3,580 | $47,290 | $11,791 | $35,499 |
| 2021 | $3,409 | $44,213 | $11,024 | $33,189 |
| 2020 | $3,302 | $42,208 | $10,524 | $31,684 |
| 2019 | $3,195 | $40,206 | $10,025 | $30,181 |
| 2018 | $2,964 | $35,977 | $9,444 | $26,533 |
| 2017 | $2,881 | $34,011 | $8,928 | $25,083 |
| 2016 | $2,725 | $31,553 | $8,283 | $23,270 |
| 2015 | -- | $28,921 | $7,592 | $21,329 |
| 2014 | -- | $28,564 | $7,498 | $21,066 |
| 2013 | -- | $29,318 | $7,696 | $21,622 |
Source: Public Records
Map
Nearby Homes
- 331 Orange St
- 462 Ashland Ave
- 3 National St Unit 3
- 7 National St Unit 7
- 552 Walnut Ave
- 208 Moseley St
- 262 Bartlett Place
- 518 Raymond St
- 96 S Crystal St
- 162 Festival Ct
- 315 Vandalia St
- 277 Gifford Place
- 211 Prairie St
- 353 Wilcox Ave
- 286 Villa St
- 756 Walnut Ave
- 800 Morgan St
- 761 South St
- 532 South St
- 835 Oak St
Your Personal Tour Guide
Ask me questions while you tour the home.