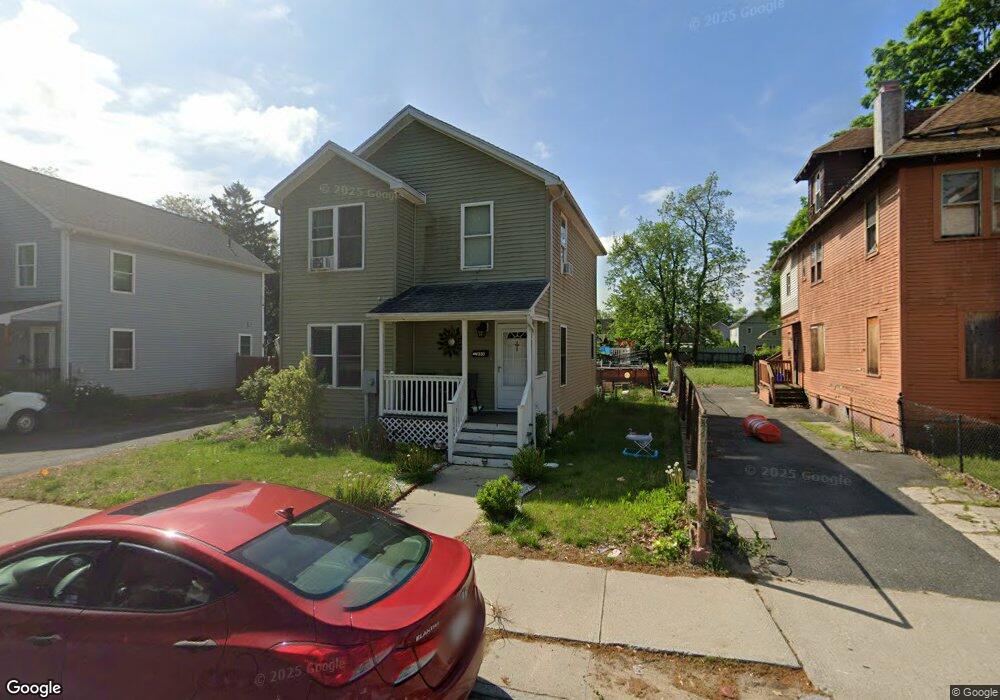
233 Quincy St Unit R Springfield, MA 01109
Old Hill NeighborhoodEstimated Value: $248,000 - $276,000
8
Beds
4
Baths
2,000
Sq Ft
$131/Sq Ft
Est. Value
About This Home
This home is located at 233 Quincy St Unit R, Springfield, MA 01109 and is currently estimated at $261,376, approximately $130 per square foot. 233 Quincy St Unit R is a home located in Hampden County with nearby schools including William N. DeBerry Elementary School, M Marcus Kiley Middle, and High School Of Commerce.
Ownership History
Date
Name
Owned For
Owner Type
Purchase Details
Closed on
Nov 17, 2017
Sold by
Habit Grtr Springfield
Bought by
Melendez Luis D and Diaz Daisy
Current Estimated Value
Home Financials for this Owner
Home Financials are based on the most recent Mortgage that was taken out on this home.
Original Mortgage
$113,000
Outstanding Balance
$94,689
Interest Rate
3.85%
Mortgage Type
New Conventional
Estimated Equity
$166,687
Purchase Details
Closed on
Oct 31, 2016
Sold by
Springfield City Of
Bought by
Greater Springfield Ha
Create a Home Valuation Report for This Property
The Home Valuation Report is an in-depth analysis detailing your home's value as well as a comparison with similar homes in the area
Home Values in the Area
Average Home Value in this Area
Purchase History
| Date | Buyer | Sale Price | Title Company |
|---|---|---|---|
| Melendez Luis D | $114,068 | -- | |
| Greater Springfield Ha | $3,000 | -- |
Source: Public Records
Mortgage History
| Date | Status | Borrower | Loan Amount |
|---|---|---|---|
| Open | Melendez Luis D | $113,000 |
Source: Public Records
Tax History Compared to Growth
Tax History
| Year | Tax Paid | Tax Assessment Tax Assessment Total Assessment is a certain percentage of the fair market value that is determined by local assessors to be the total taxable value of land and additions on the property. | Land | Improvement |
|---|---|---|---|---|
| 2025 | $3,559 | $227,000 | $26,000 | $201,000 |
| 2024 | $3,618 | $225,300 | $24,300 | $201,000 |
| 2023 | $3,255 | $190,900 | $23,200 | $167,700 |
| 2022 | $3,286 | $174,600 | $21,100 | $153,500 |
| 2021 | $3,427 | $181,300 | $19,200 | $162,100 |
| 2020 | $3,131 | $160,300 | $19,200 | $141,100 |
| 2019 | $3,025 | $153,700 | $19,200 | $134,500 |
| 2018 | $2,861 | $145,400 | $19,200 | $126,200 |
| 2017 | $0 | $147,400 | $15,400 | $132,000 |
| 2016 | -- | $142,200 | $15,400 | $126,800 |
| 2015 | -- | $39,000 | $39,000 | $0 |
Source: Public Records
Map
Nearby Homes
- 229 Quincy St
- 237 Quincy St
- 227 Quincy St Unit 2
- 225 Quincy St Unit 1
- 225 Quincy St Unit A
- 225 Quincy St Unit 225
- 225 Quincy St
- 227 Quincy St
- 225 Quincy St Unit R
- 221 Quincy St Unit 223
- 221 Quincy St Unit 1
- 221-223 Quincy St
- 249 Quincy St
- 240 Tyler St
- 252 Tyler St
- 251 Quincy St
- 236 Tyler St
- 254 Tyler St Unit 256
- 254 Tyler St Unit 1
- 254 Tyler St Unit 2