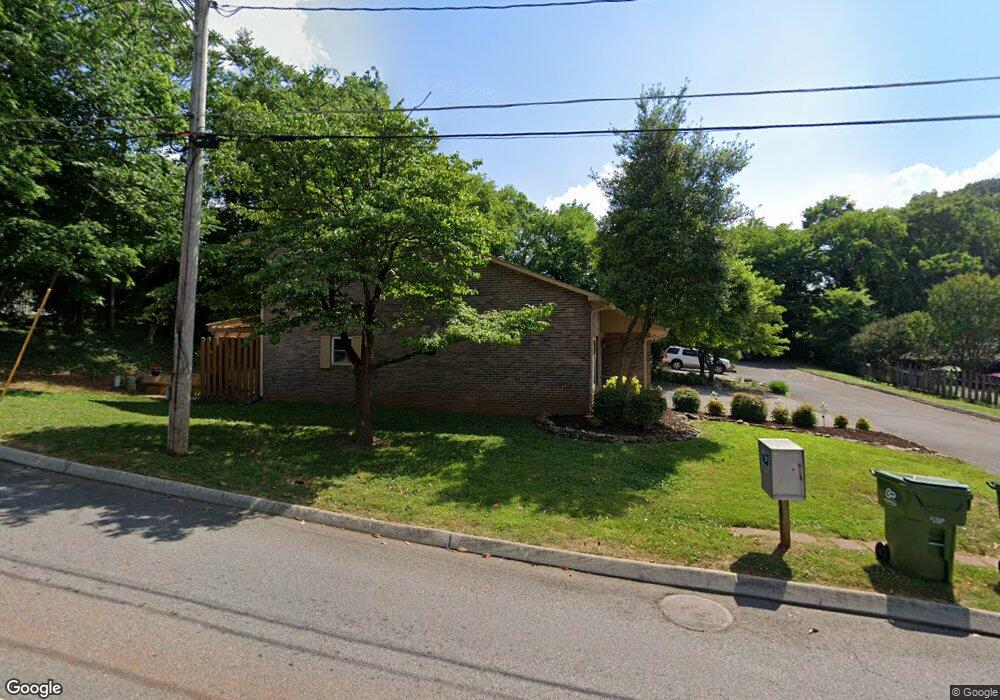
233 S Cedar St Unit 1 Maryville, TN 37803
Estimated Value: $286,000 - $359,000
3
Beds
2
Baths
1,353
Sq Ft
$235/Sq Ft
Est. Value
About This Home
This home is located at 233 S Cedar St Unit 1, Maryville, TN 37803 and is currently estimated at $317,641, approximately $234 per square foot. 233 S Cedar St Unit 1 is a home located in Blount County with nearby schools including Sam Houston Elementary School, Maryville Junior High School, and Montgomery Ridge Intermediate School.
Ownership History
Date
Name
Owned For
Owner Type
Purchase Details
Closed on
Oct 17, 2018
Sold by
Vigilante Donna Marie
Bought by
Mccoy Donny and Lois
Current Estimated Value
Purchase Details
Closed on
Jan 15, 2016
Sold by
Wehnes William James
Bought by
Vigilante Donna M
Purchase Details
Closed on
Jun 21, 2007
Sold by
Reding Roberta M
Bought by
Wehnes William James
Home Financials for this Owner
Home Financials are based on the most recent Mortgage that was taken out on this home.
Original Mortgage
$129,900
Interest Rate
6.35%
Purchase Details
Closed on
Jul 12, 2004
Sold by
Gourley Kevin R
Bought by
Reding Roberta M
Purchase Details
Closed on
Jul 6, 1990
Bought by
Gamble Linda S
Purchase Details
Closed on
Jul 13, 1988
Bought by
Austin Lisa B
Purchase Details
Closed on
Mar 15, 1985
Bought by
Hill Lorraine M
Create a Home Valuation Report for This Property
The Home Valuation Report is an in-depth analysis detailing your home's value as well as a comparison with similar homes in the area
Home Values in the Area
Average Home Value in this Area
Purchase History
| Date | Buyer | Sale Price | Title Company |
|---|---|---|---|
| Mccoy Donny | $143,000 | -- | |
| Vigilante Donna M | -- | -- | |
| Wehnes William James | $129,900 | -- | |
| Reding Roberta M | $100,500 | -- | |
| Gamble Linda S | $61,900 | -- | |
| Austin Lisa B | -- | -- | |
| Hill Lorraine M | -- | -- |
Source: Public Records
Mortgage History
| Date | Status | Borrower | Loan Amount |
|---|---|---|---|
| Previous Owner | Hill Lorraine M | $129,900 |
Source: Public Records
Tax History Compared to Growth
Tax History
| Year | Tax Paid | Tax Assessment Tax Assessment Total Assessment is a certain percentage of the fair market value that is determined by local assessors to be the total taxable value of land and additions on the property. | Land | Improvement |
|---|---|---|---|---|
| 2025 | -- | $57,000 | $0 | $0 |
| 2024 | $906 | $57,000 | $10,000 | $47,000 |
| 2023 | $906 | $57,000 | $10,000 | $47,000 |
| 2022 | $848 | $34,350 | $5,000 | $29,350 |
| 2021 | $1,628 | $34,350 | $5,000 | $29,350 |
| 2020 | $1,628 | $34,350 | $5,000 | $29,350 |
| 2019 | $1,628 | $34,350 | $5,000 | $29,350 |
| 2018 | $1,278 | $26,975 | $5,000 | $21,975 |
| 2017 | $1,278 | $26,975 | $5,000 | $21,975 |
| 2016 | $1,251 | $26,975 | $5,000 | $21,975 |
| 2015 | $1,165 | $26,975 | $5,000 | $21,975 |
| 2014 | $1,132 | $26,975 | $5,000 | $21,975 |
| 2013 | $1,132 | $26,200 | $0 | $0 |
Source: Public Records
Map
Nearby Homes
- 239 S Magnolia St
- 1113 Melvin Ave
- 409 Melrose St
- 108 S Maple St Unit 120
- 508 S Ruth St
- 403 S Maple St
- 507 Montvale Rd Unit 511
- 418 Highland Ave
- 411 S Maple St
- 1115 Tapoco Ave
- 810 S Cedar St
- 298 Gamble Ave
- 443 Landau Dr
- 522 N Houston St
- 717 Cates St Unit 725
- 406 Montvale Station Rd
- 402 Montvale Station Rd
- 405 Landau Dr
- 500 Cardinal St
- 241 Boardman Ave
- 233 S Cedar St
- 235 S Cedar St
- 235 S Cedar St Unit 2
- 237 S Cedar St
- 217 S Cedar St Unit 217
- 239 S Cedar St
- 215 S Cedar St
- 241 S Cedar St
- 817 Mountain View Ave
- 907 Mountain View Ave
- 909 Mountain View Ave
- 228 S Magnolia St Unit 8
- 213 S Cedar St
- 809 Mountain View Ave Unit 813
- 226 S Magnolia St
- 224 S Magnolia St
- 224 S Magnolia St Unit 6
- 807 Mountain View Ave
- 222 S Magnolia St
- 917 Mountain View Ave