
Seller's Agent in 2012
Pam Grant
Compass
(805) 588-0714
55 in this area
108 Total Sales

Estimated Value: $456,000 - $570,000
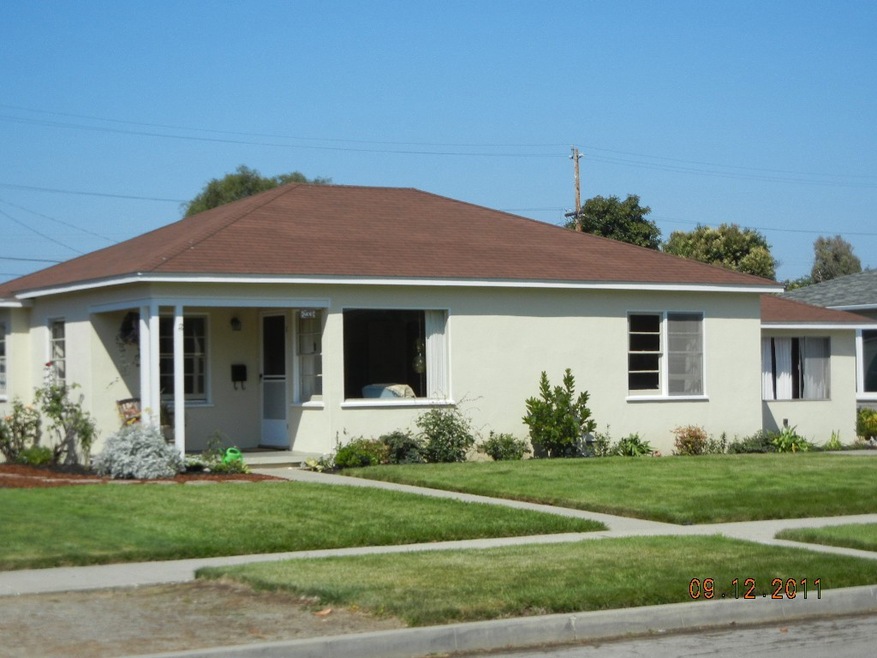
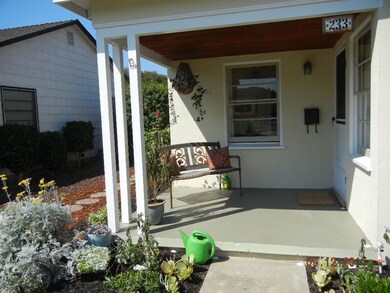
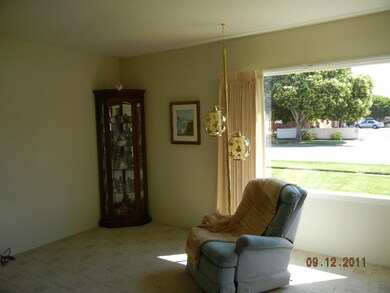
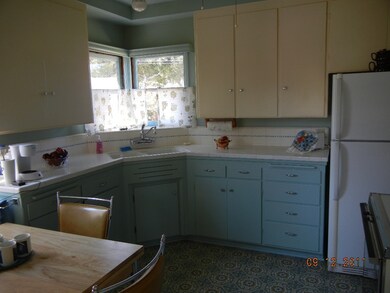
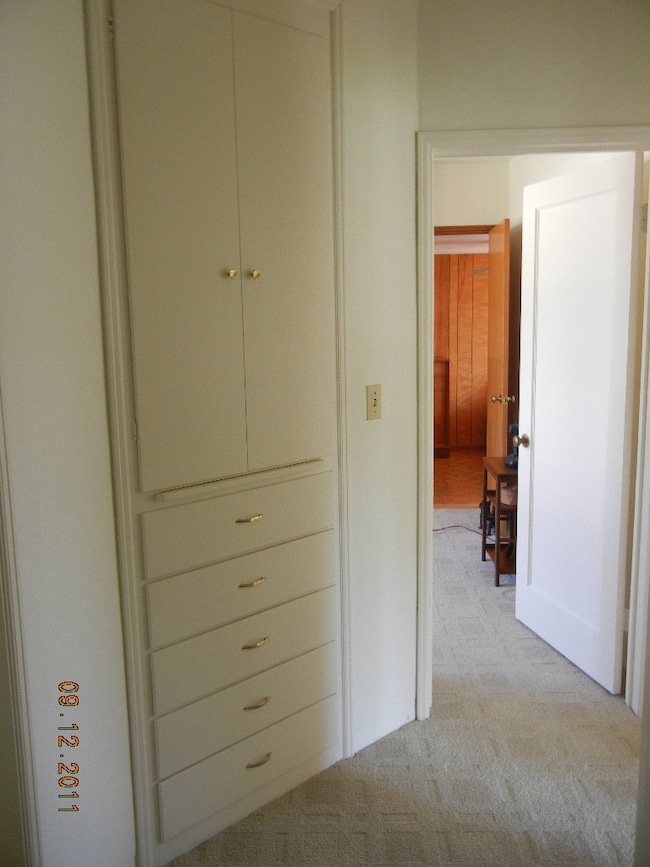
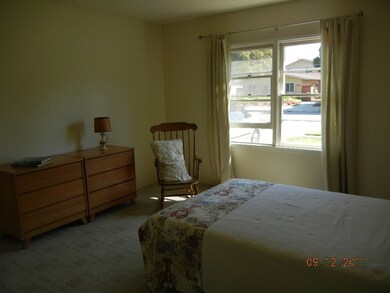
Pristine 3 bedrooms and 2 bath home on peaceful tree lined street welcomes you. Enjoy sun filled mornings from your living and dining rooms, sunsets inyour private back yard and clean out. Celebrate your new home in the patio enclosed BBQ area and create wonderful projects in the oversizeddetached 2 car garage with shop area.
Last Buyer's Agent
Non Member Agent
Non Member Office
| Date | Buyer | Sale Price | Title Company |
|---|---|---|---|
| Joseph Richard Barto Trust | -- | None Listed On Document | |
| Barto Joseph R | $190,000 | Fidelity National Title Co |
| Date | Event | Price | List to Sale | Price per Sq Ft |
|---|---|---|---|---|
| 03/05/2012 03/05/12 | Sold | $190,000 | -20.5% | $148 / Sq Ft |
| 01/26/2012 01/26/12 | Pending | -- | -- | -- |
| 09/14/2011 09/14/11 | For Sale | $239,000 | -- | $186 / Sq Ft |
| Year | Tax Paid | Tax Assessment Tax Assessment Total Assessment is a certain percentage of the fair market value that is determined by local assessors to be the total taxable value of land and additions on the property. | Land | Improvement |
|---|---|---|---|---|
| 2025 | $2,624 | $238,638 | $87,918 | $150,720 |
| 2023 | $2,624 | $229,373 | $84,505 | $144,868 |
| 2022 | $2,578 | $224,877 | $82,849 | $142,028 |
| 2021 | $2,606 | $220,469 | $81,225 | $139,244 |
| 2020 | $2,578 | $218,210 | $80,393 | $137,817 |
| 2019 | $2,535 | $213,932 | $78,817 | $135,115 |
| 2018 | $2,496 | $209,738 | $77,272 | $132,466 |
| 2017 | $2,451 | $205,626 | $75,757 | $129,869 |
| 2016 | $2,407 | $201,595 | $74,272 | $127,323 |
| 2014 | $2,355 | $194,679 | $71,724 | $122,955 |
Seller's Agent in 2012
Pam Grant
Compass
(805) 588-0714
55 in this area
108 Total Sales
N
Buyer's Agent in 2012
Non Member Agent
Non Member Office
Source: Santa Barbara Multiple Listing Service
MLS Number: 11-3177
APN: 085-212-008
Disclaimer: Certain information contained herein is derived from information provided by parties other than Homes.com. All information provided is deemed reliable, but is not guaranteed to be accurate and should be independently verified.
![]() This information is being provided for your personal, non-commercial use and may not be used for any purpose other than to identify prospective properties that you may be interested in purchasing. Data relating to real estate for sale on this Website comes from the Internet Data Exchange Program of the Santa Barbara Multiple Listing Service. All information is deemed reliable, but not guaranteed. All properties are subject to prior sale, change or withdrawal. Neither the Santa Barbara Multiple Listing Service nor the listing broker(s) shall be responsible for any typographical errors, misinformation, or misprints.
This information is being provided for your personal, non-commercial use and may not be used for any purpose other than to identify prospective properties that you may be interested in purchasing. Data relating to real estate for sale on this Website comes from the Internet Data Exchange Program of the Santa Barbara Multiple Listing Service. All information is deemed reliable, but not guaranteed. All properties are subject to prior sale, change or withdrawal. Neither the Santa Barbara Multiple Listing Service nor the listing broker(s) shall be responsible for any typographical errors, misinformation, or misprints.
Copyright 2026 Santa Barbara Multiple Listing Service. All rights reserved.
Ask me questions while you tour the home.