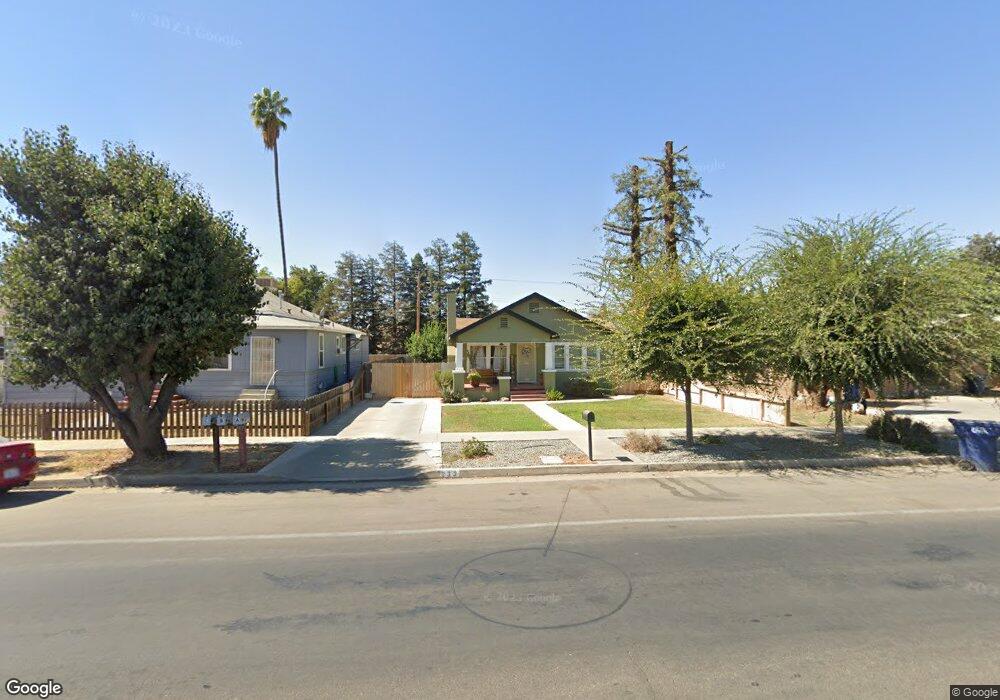
233 S E St Tulare, CA 93274
Estimated Value: $232,000 - $282,306
Studio
1
Bath
1,435
Sq Ft
$186/Sq Ft
Est. Value
About This Home
This home is located at 233 S E St, Tulare, CA 93274 and is currently estimated at $267,327, approximately $186 per square foot. 233 S E St is a home located in Tulare County with nearby schools including Maple Elementary School, Mulcahy Middle School, and Tulare Western High School.
Ownership History
Date
Name
Owned For
Owner Type
Purchase Details
Closed on
Sep 23, 2015
Sold by
Rodriguez Emberto
Bought by
Rodriguez Rosa I
Current Estimated Value
Purchase Details
Closed on
May 25, 2007
Sold by
Rogers Loren Melvin
Bought by
Rogers Esther
Home Financials for this Owner
Home Financials are based on the most recent Mortgage that was taken out on this home.
Original Mortgage
$137,951
Outstanding Balance
$83,682
Interest Rate
6.12%
Mortgage Type
FHA
Estimated Equity
$183,645
Purchase Details
Closed on
May 11, 2007
Sold by
Rogers Esther
Bought by
Rodriguez Emberto and Rodriguez Rosa I
Home Financials for this Owner
Home Financials are based on the most recent Mortgage that was taken out on this home.
Original Mortgage
$137,951
Outstanding Balance
$83,682
Interest Rate
6.12%
Mortgage Type
FHA
Estimated Equity
$183,645
Create a Home Valuation Report for This Property
The Home Valuation Report is an in-depth analysis detailing your home's value as well as a comparison with similar homes in the area
Home Values in the Area
Average Home Value in this Area
Purchase History
| Date | Buyer | Sale Price | Title Company |
|---|---|---|---|
| Rodriguez Rosa I | -- | None Available | |
| Rogers Esther | -- | First American Title Co | |
| Rodriguez Emberto | $140,000 | First American Title Co | |
| Durfee Marianne Louise | -- | First American Title Co |
Source: Public Records
Mortgage History
| Date | Status | Borrower | Loan Amount |
|---|---|---|---|
| Open | Rodriguez Emberto | $137,951 |
Source: Public Records
Tax History
| Year | Tax Paid | Tax Assessment Tax Assessment Total Assessment is a certain percentage of the fair market value that is determined by local assessors to be the total taxable value of land and additions on the property. | Land | Improvement |
|---|---|---|---|---|
| 2025 | $2,040 | $187,434 | $66,990 | $120,444 |
| 2024 | $2,040 | $183,760 | $65,677 | $118,083 |
| 2023 | $1,988 | $180,158 | $64,390 | $115,768 |
| 2022 | $1,930 | $176,627 | $63,128 | $113,499 |
| 2021 | $1,905 | $173,164 | $61,890 | $111,274 |
| 2020 | $1,937 | $171,388 | $61,255 | $110,133 |
| 2019 | $1,986 | $168,028 | $60,054 | $107,974 |
| 2018 | $1,954 | $164,733 | $58,876 | $105,857 |
| 2017 | $1,936 | $161,503 | $57,722 | $103,781 |
| 2016 | $1,836 | $157,000 | $39,000 | $118,000 |
| 2015 | $1,533 | $143,000 | $36,000 | $107,000 |
| 2014 | $1,533 | $131,000 | $33,000 | $98,000 |
Source: Public Records
Map
Nearby Homes
- 234 S D St
- 129 S C St
- 257 N F St
- 348 N F St
- 947 W Kern Ave
- 0 0 Unit CV26015491
- 560 N F St
- 1112 W San Joaquin Ave
- 1141 W San Joaquin Ave
- 202 N L St
- 748 S Walter St
- 537 S Los Angeles St
- 428 Napa St
- 605 Catalina Cir
- 620 Mariposa Ave
- 615 Catalina Cir
- 1969 Oak Falls Ct
- 1922 Oak Falls Ct Unit 5 Wo
- 1982 Oak Falls Ct Unit 1 Wo
- 1975 Oak Falls Ct Unit 8 Wo
Your Personal Tour Guide
Ask me questions while you tour the home.