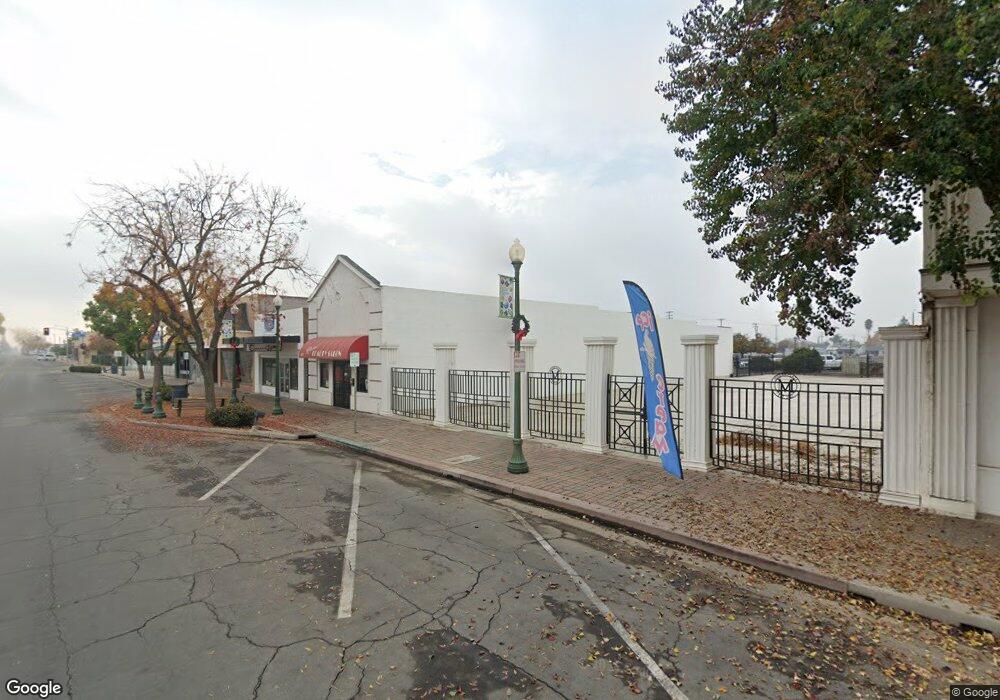
233 S K St Tulare, CA 93274
Estimated Value: $255,861
Studio
2
Baths
3,050
Sq Ft
$84/Sq Ft
Est. Value
About This Home
This home is located at 233 S K St, Tulare, CA 93274 and is currently estimated at $255,861, approximately $83 per square foot. 233 S K St is a home located in Tulare County with nearby schools including Wilson Elementary School, Cherry Avenue Middle School, and Tulare Union High School.
Ownership History
Date
Name
Owned For
Owner Type
Purchase Details
Closed on
Jan 24, 2020
Sold by
Houck Rob C
Bought by
49 Investments Llc
Current Estimated Value
Purchase Details
Closed on
Apr 11, 2005
Sold by
Sicks Bud
Bought by
Houck Rob C
Home Financials for this Owner
Home Financials are based on the most recent Mortgage that was taken out on this home.
Original Mortgage
$108,500
Interest Rate
5.56%
Mortgage Type
Commercial
Purchase Details
Closed on
Aug 3, 1999
Sold by
Avila Ethel
Bought by
Sicks Buddy R and Sicks Betty J
Home Financials for this Owner
Home Financials are based on the most recent Mortgage that was taken out on this home.
Original Mortgage
$64,000
Interest Rate
7.76%
Mortgage Type
Commercial
Create a Home Valuation Report for This Property
The Home Valuation Report is an in-depth analysis detailing your home's value as well as a comparison with similar homes in the area
Home Values in the Area
Average Home Value in this Area
Purchase History
| Date | Buyer | Sale Price | Title Company |
|---|---|---|---|
| 49 Investments Llc | $165,000 | Chicago Title Company | |
| Houck Rob C | $155,000 | Fidelity Natl Title Co Of Ca | |
| Sicks Buddy R | $80,000 | Chicago Title Co |
Source: Public Records
Mortgage History
| Date | Status | Borrower | Loan Amount |
|---|---|---|---|
| Previous Owner | Houck Rob C | $108,500 | |
| Previous Owner | Sicks Buddy R | $64,000 |
Source: Public Records
Tax History
| Year | Tax Paid | Tax Assessment Tax Assessment Total Assessment is a certain percentage of the fair market value that is determined by local assessors to be the total taxable value of land and additions on the property. | Land | Improvement |
|---|---|---|---|---|
| 2025 | $1,964 | $180,449 | $38,276 | $142,173 |
| 2024 | $1,964 | $176,912 | $37,526 | $139,386 |
| 2023 | $1,914 | $173,444 | $36,791 | $136,653 |
| 2022 | $1,858 | $170,044 | $36,070 | $133,974 |
| 2021 | $1,834 | $166,710 | $35,363 | $131,347 |
| 2020 | $2,189 | $193,686 | $43,736 | $149,950 |
| 2019 | $2,245 | $189,888 | $42,878 | $147,010 |
| 2018 | $2,208 | $186,164 | $42,037 | $144,127 |
| 2017 | $2,188 | $182,514 | $41,213 | $141,301 |
| 2016 | $2,092 | $178,935 | $40,405 | $138,530 |
| 2015 | $2,022 | $176,247 | $39,798 | $136,449 |
| 2014 | $2,022 | $172,794 | $39,018 | $133,776 |
Source: Public Records
Map
Nearby Homes
- 0 0 Unit CV26015491
- 202 N L St
- 257 N F St
- 348 N F St
- 234 S D St
- 815 E Sycamore Ave
- 861 E Sycamore Ave
- 129 S C St
- 560 N F St
- 707 W Sonora Ave
- 1072 E Sycamore Ave
- 947 W Kern Ave
- 840 E Bardsley Ave
- 908 N Beatrice Dr
- 320 N Blackstone St Unit 14
- 1112 W San Joaquin Ave
- 1141 W San Joaquin Ave
- 130 E Woodward Dr
- 560 W Pleasant Ave Unit 16
- 560 W Pleasant Ave Unit 75
Your Personal Tour Guide
Ask me questions while you tour the home.