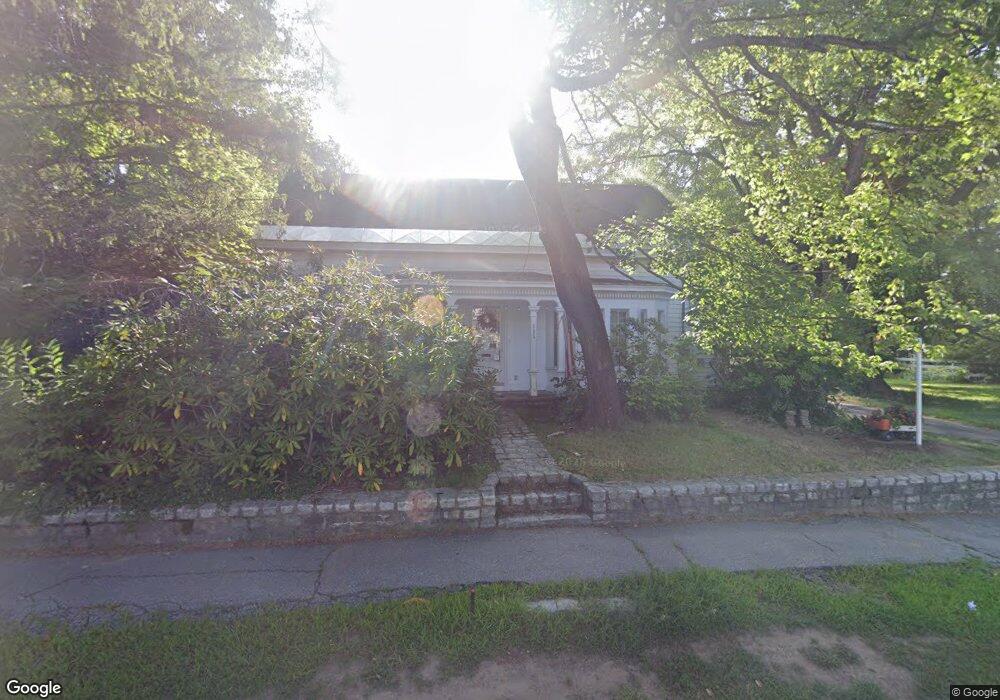
233 South St Concord, NH 03301
South End NeighborhoodEstimated Value: $621,000 - $779,000
3
Beds
2
Baths
2,718
Sq Ft
$259/Sq Ft
Est. Value
About This Home
This home is located at 233 South St, Concord, NH 03301 and is currently estimated at $704,215, approximately $259 per square foot. 233 South St is a home located in Merrimack County with nearby schools including Abbot-Downing School, Rundlett Middle School, and Concord High School.
Ownership History
Date
Name
Owned For
Owner Type
Purchase Details
Closed on
Apr 22, 2022
Sold by
Broussard Ft 2020 and Broussard
Bought by
Broussard Ft 2020 and Broussard
Current Estimated Value
Home Financials for this Owner
Home Financials are based on the most recent Mortgage that was taken out on this home.
Original Mortgage
$200,000
Interest Rate
3.5%
Mortgage Type
Adjustable Rate Mortgage/ARM
Purchase Details
Closed on
May 26, 2020
Sold by
Broussard Jemi E and Broussard Richard E
Bought by
Broussard Ft 2020 and Brousard
Purchase Details
Closed on
Oct 1, 2014
Sold by
Broussard Jemi E
Bought by
Broussard Jemi E and Broussard Richard E
Create a Home Valuation Report for This Property
The Home Valuation Report is an in-depth analysis detailing your home's value as well as a comparison with similar homes in the area
Home Values in the Area
Average Home Value in this Area
Purchase History
| Date | Buyer | Sale Price | Title Company |
|---|---|---|---|
| Broussard Ft 2020 | -- | None Available | |
| Broussard Ft | -- | None Available | |
| Broussard Ft 2020 | -- | None Available | |
| Broussard Ft | -- | None Available | |
| Broussard Ft 2020 | -- | None Available | |
| Broussard Ft 2020 | -- | None Available | |
| Broussard Jemi E | -- | -- | |
| Broussard Jemi E | -- | -- |
Source: Public Records
Mortgage History
| Date | Status | Borrower | Loan Amount |
|---|---|---|---|
| Previous Owner | Broussard Ft | $200,000 | |
| Previous Owner | Broussard Ft | $200,000 | |
| Previous Owner | Broussard Ft 2020 | $55,000 | |
| Previous Owner | Broussard Jemi E | $150,000 |
Source: Public Records
Tax History
| Year | Tax Paid | Tax Assessment Tax Assessment Total Assessment is a certain percentage of the fair market value that is determined by local assessors to be the total taxable value of land and additions on the property. | Land | Improvement |
|---|---|---|---|---|
| 2025 | $13,973 | $480,000 | $180,100 | $299,900 |
| 2024 | $13,247 | $478,400 | $180,100 | $298,300 |
| 2023 | $12,850 | $478,400 | $180,100 | $298,300 |
| 2022 | $12,386 | $478,400 | $180,100 | $298,300 |
| 2021 | $12,090 | $481,300 | $180,100 | $301,200 |
| 2020 | $11,769 | $439,800 | $143,900 | $295,900 |
| 2019 | $11,229 | $404,200 | $146,200 | $258,000 |
| 2018 | $10,991 | $389,900 | $146,200 | $243,700 |
| 2017 | $10,593 | $375,100 | $146,200 | $228,900 |
| 2016 | $10,075 | $364,100 | $143,600 | $220,500 |
| 2015 | $9,564 | $348,300 | $151,500 | $196,800 |
| 2014 | $9,338 | $348,300 | $151,500 | $196,800 |
| 2013 | -- | $348,300 | $151,500 | $196,800 |
| 2012 | -- | $349,400 | $145,400 | $204,000 |
Source: Public Records
Map
Nearby Homes
- 0 South St Unit 4969509
- 40 Nivelle St
- 289 South St
- 33 Joffre St
- 335 S Main St
- 47 Noyes St
- 273-279 S Main St
- 47 South St
- 30 Longmeadow Dr
- 58 S State St
- 111 -113 South Main St
- 7-9 Myrtle St
- 5 Holly Cir
- 5 Windchime Dr
- 25 N Spring St
- 21 Fairfield Dr
- 22 Fairfield Dr
- 20 Fairfield Dr
- 4 Bow Center Rd Unit F2
- 26 Jonathan Ln
Your Personal Tour Guide
Ask me questions while you tour the home.