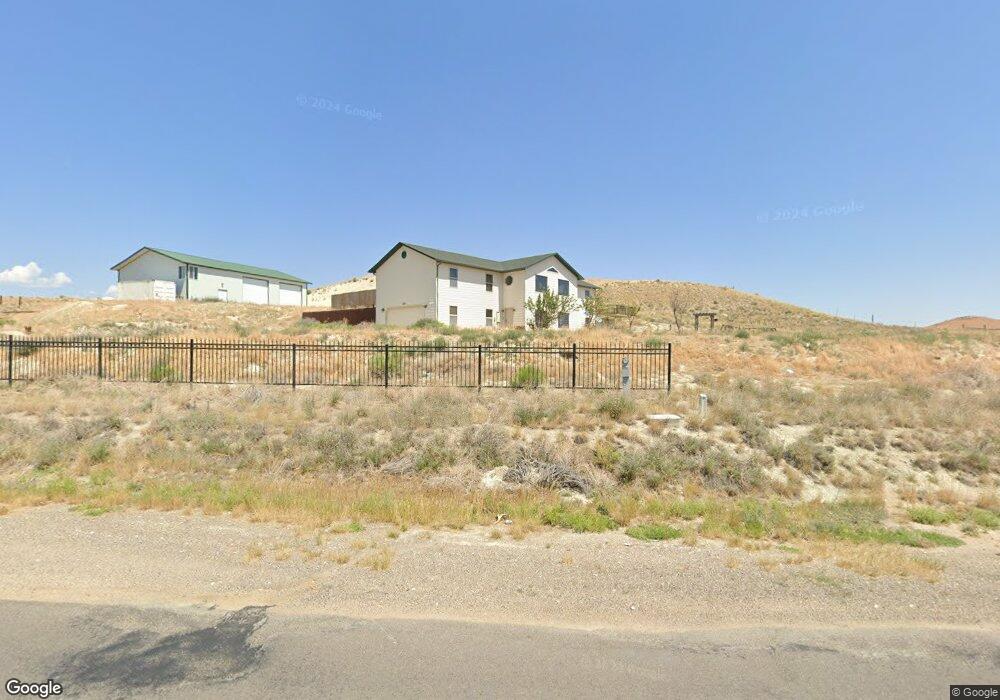
233 Springfield Pkwy Spring Creek, NV 89815
Estimated Value: $531,000 - $804,635
3
Beds
3
Baths
3,264
Sq Ft
$194/Sq Ft
Est. Value
About This Home
This home is located at 233 Springfield Pkwy, Spring Creek, NV 89815 and is currently estimated at $632,159, approximately $193 per square foot. 233 Springfield Pkwy is a home located in Elko County with nearby schools including Spring Creek Elementary School, Spring Creek Middle School, and Spring Creek High School.
Ownership History
Date
Name
Owned For
Owner Type
Purchase Details
Closed on
Jun 11, 2010
Sold by
Horschel Heather L
Bought by
Horschel Luke S
Current Estimated Value
Home Financials for this Owner
Home Financials are based on the most recent Mortgage that was taken out on this home.
Original Mortgage
$246,627
Outstanding Balance
$166,502
Interest Rate
5.12%
Mortgage Type
FHA
Estimated Equity
$465,657
Purchase Details
Closed on
May 26, 2010
Sold by
Hawkes Tony and Hawkes Cheryl
Bought by
Horschel Luke S
Home Financials for this Owner
Home Financials are based on the most recent Mortgage that was taken out on this home.
Original Mortgage
$246,627
Outstanding Balance
$166,502
Interest Rate
5.12%
Mortgage Type
FHA
Estimated Equity
$465,657
Purchase Details
Closed on
Jan 19, 2009
Sold by
Dedolph John F
Bought by
Hawkes Tony and Hawkes Cheryl
Purchase Details
Closed on
Oct 12, 2005
Sold by
Custer Steven R and Custer Gretchen L
Bought by
Dedolph John F and Dedolph Sharon L
Create a Home Valuation Report for This Property
The Home Valuation Report is an in-depth analysis detailing your home's value as well as a comparison with similar homes in the area
Home Values in the Area
Average Home Value in this Area
Purchase History
| Date | Buyer | Sale Price | Title Company |
|---|---|---|---|
| Horschel Luke S | -- | Stewart Title Elko | |
| Horschel Luke S | $250,000 | Stewart Title Elko | |
| Hawkes Tony | $12,000 | Stewart Title Elko | |
| Dedolph John F | $17,500 | Stewart Title |
Source: Public Records
Mortgage History
| Date | Status | Borrower | Loan Amount |
|---|---|---|---|
| Open | Horschel Luke S | $246,627 |
Source: Public Records
Tax History Compared to Growth
Tax History
| Year | Tax Paid | Tax Assessment Tax Assessment Total Assessment is a certain percentage of the fair market value that is determined by local assessors to be the total taxable value of land and additions on the property. | Land | Improvement |
|---|---|---|---|---|
| 2025 | $4,628 | $168,950 | $17,500 | $151,450 |
| 2024 | $4,628 | $172,772 | $17,500 | $155,272 |
| 2023 | $4,034 | $161,173 | $16,800 | $144,373 |
| 2022 | $3,691 | $137,797 | $16,800 | $120,997 |
| 2021 | $3,723 | $134,389 | $16,800 | $117,589 |
| 2020 | $3,526 | $135,519 | $16,800 | $118,719 |
| 2019 | $3,403 | $120,519 | $7,700 | $112,819 |
| 2018 | $3,377 | $120,033 | $7,700 | $112,333 |
| 2017 | $2,506 | $97,701 | $7,700 | $90,001 |
| 2016 | $2,510 | $97,014 | $7,700 | $89,314 |
| 2015 | $2,486 | $95,822 | $7,700 | $88,122 |
| 2014 | $2,457 | $91,321 | $7,700 | $83,621 |
Source: Public Records
Map
Nearby Homes
- 522 Shadybrook Dr
- 486 Shadybrook Dr
- 254 Springfield Pkwy
- 452 Rawlings Dr
- 263 Springfield Pkwy
- 514 Shadybrook Dr
- 444 Rawlings Dr
- 526 Shadybrook Dr
- 480 Shadypoint Dr
- 630 Shadybrook Dr
- 302 Springfield Pkwy
- 559 Diamondback Dr
- 4 Licht Pkwy
- 22 Gallinas Dr
- 422 Diamondback Dr
- 187 Flowing Wells Dr
- 277 Glenvista Dr
- 470 Lawndale Dr
- 728 Diamondback Dr
- 527 Lawndale Place
- 454 Shadybrook Dr
- 221 Springfield Pkwy
- 230 Springfield Pkwy
- 458 Shadybrook Dr
- 238 Springfield Pkwy
- 450 Shadybrook Dr
- 470 Shadybrook Dr
- 0 Shadybrook Dr
- 457 Shadybrook Dr
- 248 Springfield Pkwy
- 482 Shadybrook Dr
- 449 Shadybrook Dr
- 471 Shadybrook Dr
- 475 Shadybrook Dr
- 250 Springfield Pkwy
- 479 Shadybrook Dr
- 483 Shadybrook Dr
- 490 Shadybrook Dr
- 414 Shadybrook Dr
- 261 Springfield Pkwy