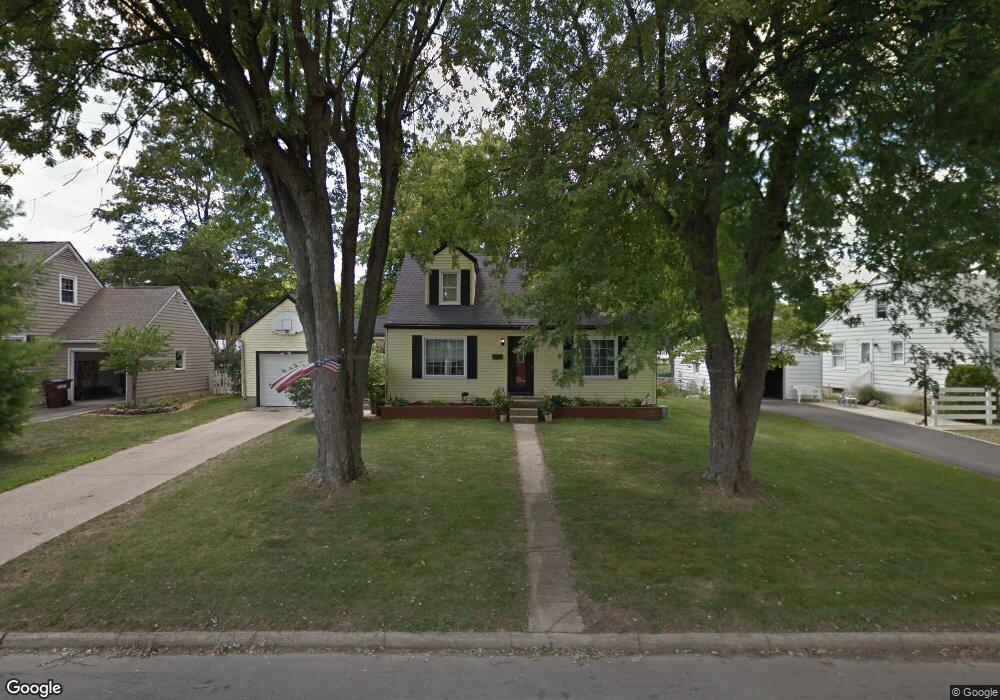
233 Tate Ave Englewood, OH 45322
Estimated Value: $172,000 - $201,000
3
Beds
1
Bath
1,254
Sq Ft
$149/Sq Ft
Est. Value
About This Home
This home is located at 233 Tate Ave, Englewood, OH 45322 and is currently estimated at $186,535, approximately $148 per square foot. 233 Tate Ave is a home located in Montgomery County with nearby schools including Northmont High School, Imagine Schools - Woodbury Academy, and Salem Christian Academy.
Ownership History
Date
Name
Owned For
Owner Type
Purchase Details
Closed on
May 27, 2016
Sold by
Hutchins Ricky L
Bought by
Didier Douglas J
Current Estimated Value
Home Financials for this Owner
Home Financials are based on the most recent Mortgage that was taken out on this home.
Original Mortgage
$92,773
Outstanding Balance
$75,769
Interest Rate
4.4%
Mortgage Type
FHA
Estimated Equity
$110,766
Purchase Details
Closed on
Sep 30, 2015
Sold by
Secretary Of Veterans Affairs
Bought by
Hutchins Ricky L
Purchase Details
Closed on
Jun 8, 2015
Sold by
Plemons Floyd D
Bought by
Secretary Of Veterans Affairs
Purchase Details
Closed on
Feb 11, 1998
Sold by
Plemons Marie L
Bought by
Plemons Floyd D
Create a Home Valuation Report for This Property
The Home Valuation Report is an in-depth analysis detailing your home's value as well as a comparison with similar homes in the area
Home Values in the Area
Average Home Value in this Area
Purchase History
| Date | Buyer | Sale Price | Title Company |
|---|---|---|---|
| Didier Douglas J | $94,500 | Partners Land Title Agency | |
| Hutchins Ricky L | -- | Partners Land Title Agency | |
| Secretary Of Veterans Affairs | $48,000 | Attorney | |
| Plemons Floyd D | -- | -- | |
| Plemons Floyd D | -- | -- |
Source: Public Records
Mortgage History
| Date | Status | Borrower | Loan Amount |
|---|---|---|---|
| Open | Didier Douglas J | $92,773 |
Source: Public Records
Tax History Compared to Growth
Tax History
| Year | Tax Paid | Tax Assessment Tax Assessment Total Assessment is a certain percentage of the fair market value that is determined by local assessors to be the total taxable value of land and additions on the property. | Land | Improvement |
|---|---|---|---|---|
| 2024 | $2,583 | $45,190 | $9,310 | $35,880 |
| 2023 | $2,583 | $45,190 | $9,310 | $35,880 |
| 2022 | $2,361 | $31,780 | $6,560 | $25,220 |
| 2021 | $2,368 | $31,780 | $6,560 | $25,220 |
| 2020 | $2,324 | $31,780 | $6,560 | $25,220 |
| 2019 | $2,181 | $26,720 | $7,540 | $19,180 |
| 2018 | $2,142 | $26,720 | $7,540 | $19,180 |
| 2017 | $2,127 | $26,720 | $7,540 | $19,180 |
| 2016 | $2,123 | $25,560 | $6,560 | $19,000 |
| 2015 | $1,894 | $25,560 | $6,560 | $19,000 |
| 2014 | $1,894 | $25,560 | $6,560 | $19,000 |
| 2012 | -- | $31,840 | $7,210 | $24,630 |
Source: Public Records
Map
Nearby Homes