Estimated Value: $89,297 - $168,000
2
Beds
1
Bath
1,210
Sq Ft
$106/Sq Ft
Est. Value
About This Home
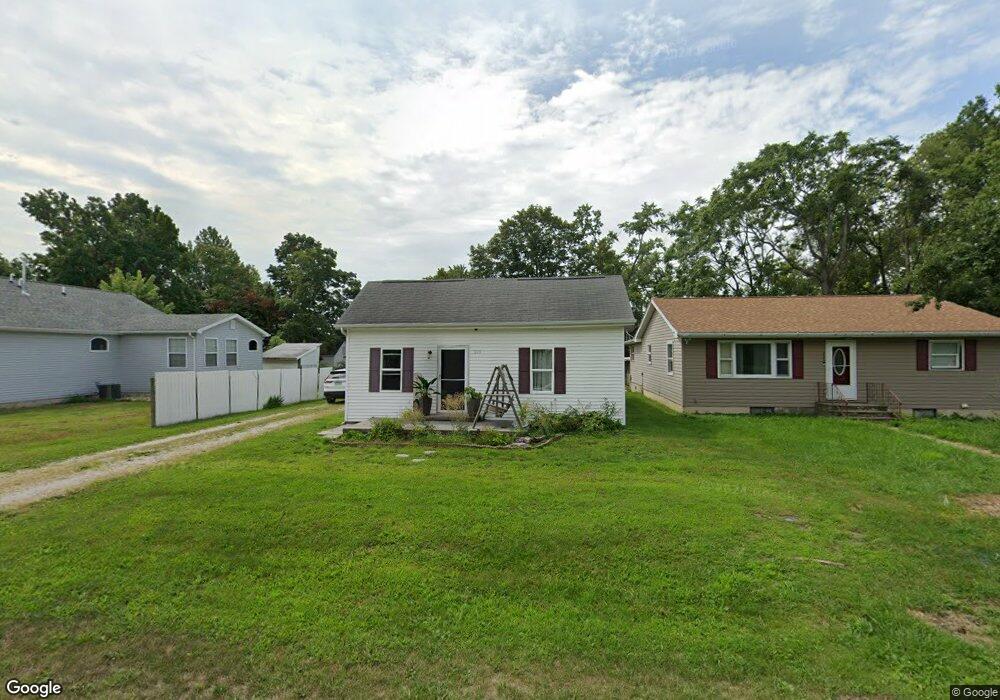
This home is located at 233 W Dunn St, Macon, IL 62544 and is currently estimated at $128,824, approximately $106 per square foot. 233 W Dunn St is a home located in Macon County with nearby schools including Meridian Middle School and Meridian High School.
Ownership History
Date
Name
Owned For
Owner Type
Purchase Details
Closed on
Oct 5, 2018
Sold by
Burrus Natalie
Bought by
Dillbeck Alexis M
Current Estimated Value
Home Financials for this Owner
Home Financials are based on the most recent Mortgage that was taken out on this home.
Original Mortgage
$63,712
Outstanding Balance
$55,561
Interest Rate
4.5%
Mortgage Type
New Conventional
Estimated Equity
$73,263
Purchase Details
Closed on
Oct 26, 2012
Sold by
Coffman Stephen J and Neil Wendel E
Bought by
Burrus Natalie
Home Financials for this Owner
Home Financials are based on the most recent Mortgage that was taken out on this home.
Original Mortgage
$59,218
Interest Rate
3.75%
Mortgage Type
FHA
Purchase Details
Closed on
Sep 1, 2012
Home Financials for this Owner
Home Financials are based on the most recent Mortgage that was taken out on this home.
Original Mortgage
$59,218
Interest Rate
3.75%
Mortgage Type
FHA
Purchase Details
Closed on
Oct 10, 2010
Sold by
Conder Darrin Dean
Bought by
Coffman Stephen J
Purchase Details
Closed on
May 1, 1998
Create a Home Valuation Report for This Property
The Home Valuation Report is an in-depth analysis detailing your home's value as well as a comparison with similar homes in the area
Home Values in the Area
Average Home Value in this Area
Purchase History
| Date | Buyer | Sale Price | Title Company |
|---|---|---|---|
| Dillbeck Alexis M | $65,000 | None Available | |
| Burrus Natalie | $30,500 | None Available | |
| -- | $61,000 | -- | |
| Coffman Stephen J | $9,500 | None Available | |
| -- | $20,000 | -- |
Source: Public Records
Mortgage History
| Date | Status | Borrower | Loan Amount |
|---|---|---|---|
| Open | Dillbeck Alexis M | $63,712 | |
| Previous Owner | Burrus Natalie | $59,218 |
Source: Public Records
Tax History Compared to Growth
Tax History
| Year | Tax Paid | Tax Assessment Tax Assessment Total Assessment is a certain percentage of the fair market value that is determined by local assessors to be the total taxable value of land and additions on the property. | Land | Improvement |
|---|---|---|---|---|
| 2024 | $1,621 | $27,808 | $3,212 | $24,596 |
| 2023 | $1,485 | $25,193 | $2,910 | $22,283 |
| 2022 | $1,441 | $24,063 | $2,779 | $21,284 |
| 2021 | $1,398 | $22,857 | $2,640 | $20,217 |
| 2020 | $1,357 | $21,540 | $2,488 | $19,052 |
| 2019 | $1,357 | $21,540 | $2,488 | $19,052 |
| 2018 | $1,316 | $21,029 | $2,429 | $18,600 |
| 2017 | $1,319 | $21,117 | $2,439 | $18,678 |
| 2016 | $1,358 | $21,092 | $2,436 | $18,656 |
| 2015 | $1,034 | $17,600 | $2,365 | $15,235 |
| 2014 | $976 | $17,426 | $2,342 | $15,084 |
| 2013 | $995 | $17,426 | $2,342 | $15,084 |
Source: Public Records
Map
Nearby Homes
- 275 W Cole St
- 161 N Front St
- 206 W Andrews St
- 124 Robin Dr
- 501 W Walker Rd Unit Macon Illinois 62544
- Lot 13 Galeana Dr
- Lot 52 Galeana Dr
- Lot 12 Galeana Dr
- Lot 51 Galeana Dr
- Lot 50 Galeana Dr
- Lot 5 Galena Dr
- Lot 6 Galena Dr
- Lot 7 Galena Dr
- Lot 8 Galena Dr
- Lot 10 Galena Dr
- Lot 11 Galeana Dr
- Lot 9 Galeana Dr
- Lot 49 Galeana Dr
- Lot 14 Lakelaine Dr
- Lot 15 Lakelaine Dr
- 235 W Dunn St
- 255 W Dunn St
- 133 S Miller St
- 101 S Miller St
- 265 W Dunn St
- 226 W Dunn St
- 228 W Eckhardt St
- 246 W Eckhardt St
- 202 W Eckhardt St
- 262 W Dunn St
- 283 W Dunn St
- 242 W Dunn St
- 268 W Eckhardt St
- 101 N Miller St
- 191 W Dunn St
- 280 W Dunn St
- 102 S Shaw St
- 183 W Dunn St
- 294 W Eckhardt St
- 194 W Dunn St