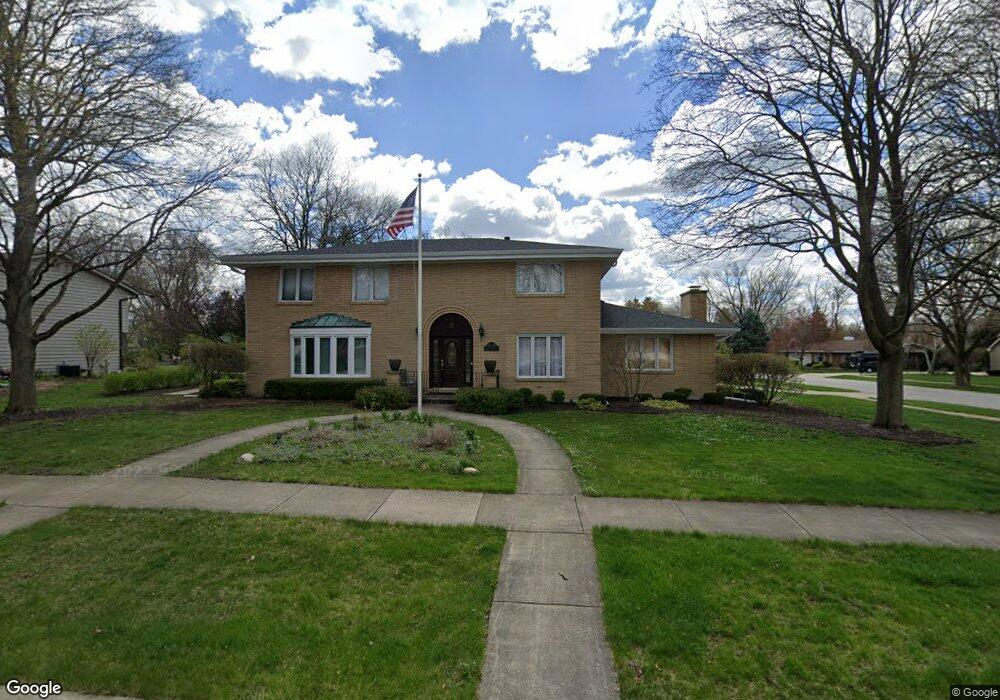
2330 Coach And Surrey Ln Unit 4 Aurora, IL 60506
Blackberry Countryside NeighborhoodEstimated Value: $480,000 - $505,575
4
Beds
3
Baths
3,546
Sq Ft
$138/Sq Ft
Est. Value
About This Home
This home is located at 2330 Coach And Surrey Ln Unit 4, Aurora, IL 60506 and is currently estimated at $489,644, approximately $138 per square foot. 2330 Coach And Surrey Ln Unit 4 is a home located in Kane County with nearby schools including Freeman Elementary School, Washington Middle School, and West Aurora High School.
Ownership History
Date
Name
Owned For
Owner Type
Purchase Details
Closed on
Oct 17, 2020
Sold by
Stanciu Daniel J and Stanciu Susan K
Bought by
Stanciu Daniel J and Marit Susan
Current Estimated Value
Purchase Details
Closed on
Nov 29, 2001
Sold by
Stanciu Daniel J and Stanciu Susan K
Bought by
Stanciu Daniel J and Stanciu Susan K
Home Financials for this Owner
Home Financials are based on the most recent Mortgage that was taken out on this home.
Original Mortgage
$154,000
Interest Rate
7.07%
Purchase Details
Closed on
Sep 23, 1994
Sold by
Dobbins James L and Dobbins Virginia A
Bought by
Daniel J Stanciu Trust
Home Financials for this Owner
Home Financials are based on the most recent Mortgage that was taken out on this home.
Original Mortgage
$127,000
Interest Rate
7.8%
Create a Home Valuation Report for This Property
The Home Valuation Report is an in-depth analysis detailing your home's value as well as a comparison with similar homes in the area
Home Values in the Area
Average Home Value in this Area
Purchase History
| Date | Buyer | Sale Price | Title Company |
|---|---|---|---|
| Stanciu Daniel J | -- | Chicago Title Insurance Co | |
| Stanciu Daniel J | -- | First American Title Ins Co | |
| Daniel J Stanciu Trust | $130,333 | First American Title Ins Co |
Source: Public Records
Mortgage History
| Date | Status | Borrower | Loan Amount |
|---|---|---|---|
| Closed | Stanciu Daniel J | $154,000 | |
| Closed | Daniel J Stanciu Trust | $127,000 |
Source: Public Records
Tax History Compared to Growth
Tax History
| Year | Tax Paid | Tax Assessment Tax Assessment Total Assessment is a certain percentage of the fair market value that is determined by local assessors to be the total taxable value of land and additions on the property. | Land | Improvement |
|---|---|---|---|---|
| 2024 | $11,154 | $156,866 | $20,956 | $135,910 |
| 2023 | $11,320 | $140,159 | $18,724 | $121,435 |
| 2022 | $10,789 | $127,882 | $17,084 | $110,798 |
| 2021 | $9,942 | $114,823 | $15,905 | $98,918 |
| 2020 | $9,423 | $106,653 | $14,773 | $91,880 |
| 2019 | $9,605 | $104,231 | $13,688 | $90,543 |
| 2018 | $9,883 | $105,000 | $12,661 | $92,339 |
| 2017 | $9,674 | $100,000 | $11,666 | $88,334 |
| 2016 | $10,875 | $108,371 | $12,654 | $95,717 |
| 2015 | -- | $98,837 | $10,881 | $87,956 |
| 2014 | -- | $99,804 | $10,465 | $89,339 |
| 2013 | -- | $97,351 | $9,284 | $88,067 |
Source: Public Records
Map
Nearby Homes
- 2351 Tanglewood Dr
- 2350 Tanglewood Ct Unit 4
- 375 S Constitution Dr
- 381 S Constitution Dr
- 393 S Constitution Dr
- 405 S Constitution Dr
- 27 S Canterbury Rd
- Napa Plan at Prairie Meadows
- Siena Plan at Prairie Meadows
- Sonoma Plan at Prairie Meadows
- Rutherford Plan at Prairie Meadows
- 417 S Constitution Dr
- 2220 Mayflower St
- 522 Kingsway Dr W
- 1730 W Galena Blvd Unit 402E
- 7S355 Midfield Dr
- 1751 Greene Ct
- 1735 Greene Ct
- 2972 Trillium Ct E
- 115 Hillwood Place Unit 4B
- 2320 Coach And Surrey Ln Unit 4
- 248 Carriage Hill Dr Unit 4
- 2314 Coach And Surrey Ln
- 245 Carriage Hill Dr
- 252 Carriage Hill Dr
- 2335 Coach And Surrey Ln Unit 4
- 2345 Coach And Surrey Ln
- 247 Carriage Hill Dr
- 2325 Coach And Surrey Ln Unit 4
- 2355 Coach And Surrey Ln
- 256 Carriage Hill Dr
- 249 Carriage Hill Dr
- 2315 Coach And Surrey Ln
- 2308 Coach And Surrey Ln
- 2365 Coach And Surrey Ln
- 251 Carriage Hill Dr Unit 4
- 258 Carriage Hill Dr
- 2305 Coach And Surrey Ln
- 2300 Coach And Surrey Ln
- 160 Stillwater Ct