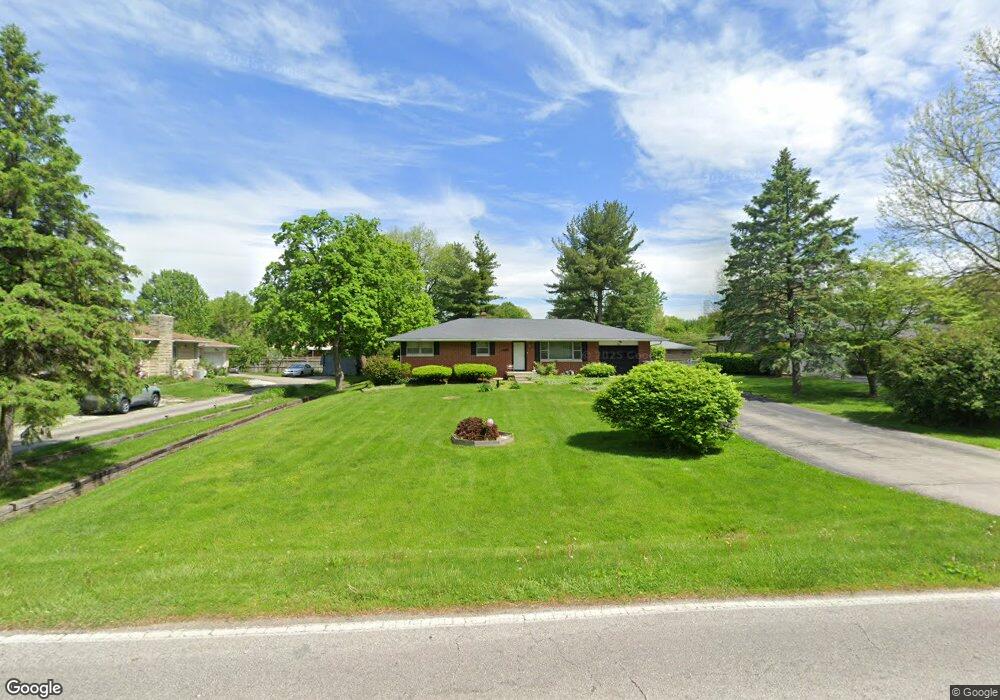
2330 E Banta Rd Indianapolis, IN 46227
Estimated Value: $237,000 - $295,000
3
Beds
2
Baths
2,322
Sq Ft
$109/Sq Ft
Est. Value
About This Home
This home is located at 2330 E Banta Rd, Indianapolis, IN 46227 and is currently estimated at $253,648, approximately $109 per square foot. 2330 E Banta Rd is a home located in Marion County with nearby schools including Southport Elementary School, Southport 6th Grade Academy, and Southport Middle School.
Ownership History
Date
Name
Owned For
Owner Type
Purchase Details
Closed on
Jan 27, 2020
Sold by
Timms Joseph and Hicks Karen M
Bought by
Timms Jsoeph
Current Estimated Value
Home Financials for this Owner
Home Financials are based on the most recent Mortgage that was taken out on this home.
Original Mortgage
$144,078
Outstanding Balance
$125,732
Interest Rate
2.87%
Mortgage Type
FHA
Estimated Equity
$127,916
Purchase Details
Closed on
Nov 21, 2017
Sold by
Wise Jeffrey M
Bought by
Joseph Timms and Hicks Karen M
Home Financials for this Owner
Home Financials are based on the most recent Mortgage that was taken out on this home.
Original Mortgage
$131,572
Interest Rate
4.37%
Mortgage Type
FHA
Purchase Details
Closed on
Jul 17, 2008
Sold by
Thompson Robert W and Estate Of Virginia R Thompson
Bought by
Wise Jeffrey M
Home Financials for this Owner
Home Financials are based on the most recent Mortgage that was taken out on this home.
Original Mortgage
$137,837
Interest Rate
6.36%
Mortgage Type
FHA
Create a Home Valuation Report for This Property
The Home Valuation Report is an in-depth analysis detailing your home's value as well as a comparison with similar homes in the area
Home Values in the Area
Average Home Value in this Area
Purchase History
| Date | Buyer | Sale Price | Title Company |
|---|---|---|---|
| Timms Jsoeph | -- | None Available | |
| Joseph Timms | $134,000 | -- | |
| Timms Joseph | $134,000 | Chicago Title | |
| Wise Jeffrey M | -- | None Available |
Source: Public Records
Mortgage History
| Date | Status | Borrower | Loan Amount |
|---|---|---|---|
| Open | Timms Jsoeph | $144,078 | |
| Closed | Timms Joseph | $131,572 | |
| Previous Owner | Wise Jeffrey M | $137,837 |
Source: Public Records
Tax History Compared to Growth
Tax History
| Year | Tax Paid | Tax Assessment Tax Assessment Total Assessment is a certain percentage of the fair market value that is determined by local assessors to be the total taxable value of land and additions on the property. | Land | Improvement |
|---|---|---|---|---|
| 2024 | $1,861 | $199,800 | $27,200 | $172,600 |
| 2023 | $1,861 | $189,600 | $27,200 | $162,400 |
| 2022 | $1,824 | $171,700 | $27,200 | $144,500 |
| 2021 | $1,788 | $156,700 | $27,200 | $129,500 |
| 2020 | $1,914 | $142,700 | $27,200 | $115,500 |
| 2019 | $1,635 | $127,300 | $22,000 | $105,300 |
| 2018 | $1,587 | $124,200 | $22,000 | $102,200 |
| 2017 | $1,546 | $122,500 | $22,000 | $100,500 |
| 2016 | $3,200 | $119,400 | $22,000 | $97,400 |
| 2014 | $1,252 | $117,700 | $22,000 | $95,700 |
| 2013 | $1,344 | $117,700 | $22,000 | $95,700 |
Source: Public Records
Map
Nearby Homes
- 6546 Derbyshire Rd
- 6601 Twin Brooks Dr
- 2224 Fairhope Dr
- 2620 Maynard Dr
- 6075 Hardegan St
- 1721 Southview Dr
- 6602 Madison Ave
- 6301 Madison Ave
- 6644 Mcfarland Rd
- 700 E Werges Ave
- 1610 Southview Dr
- 6104 Madison Ave
- 5814 Villa Ave
- 6332 Bryan Dr
- 135 South St
- 106 Walnut St
- 3552 Tulip Dr
- 3265 Tulip Dr
- 278 Anniston Dr
- 5902 S Gale St
- 2346 E Banta Rd
- 2326 E Banta Rd
- 2335 Cardinal Dr
- 2316 E Banta Rd
- 2390 E Banta Rd
- 2345 Cardinal Dr
- 2345 E Banta Rd
- 2335 E Banta Rd
- 2400 E Banta Rd
- 2325 E Banta Rd
- 2307 Cardinal Dr
- 2305 E Banta Rd
- 2395 Cardinal Dr
- 2402 Cardinal Dr
- 6376 S Keystone Ave
- 2404 E Banta Rd
- 2250 E Banta Rd
- 6375 Derbyshire Rd
- 6366 S Keystone Ave
- 2245 Cardinal Dr