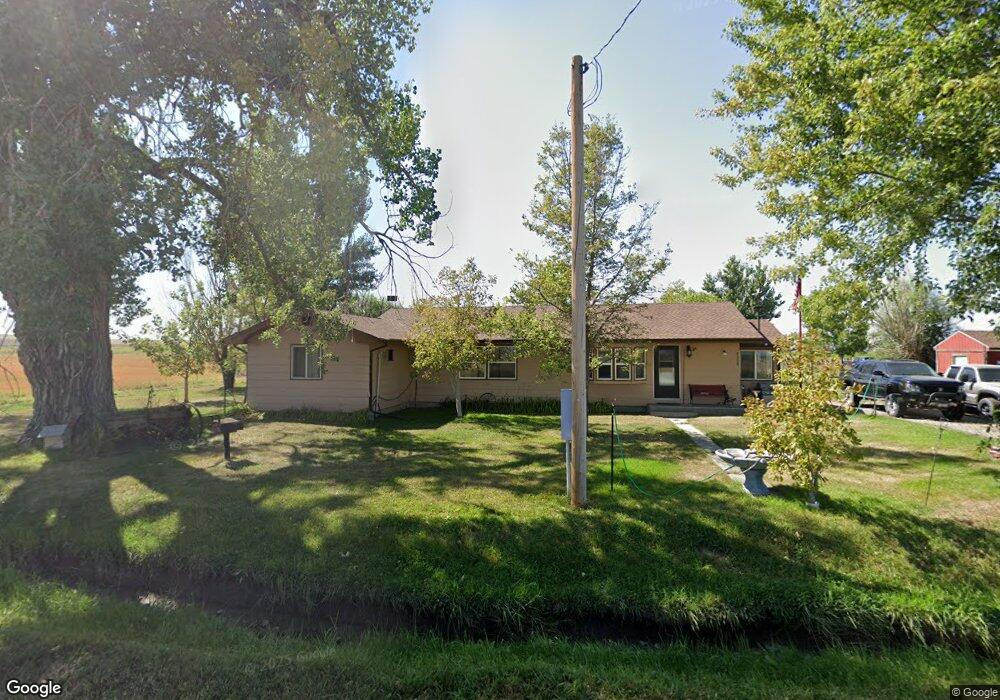
2330 S 26th Rd Ballantine, MT 59006
Estimated Value: $492,000 - $554,000
3
Beds
2
Baths
1,992
Sq Ft
$261/Sq Ft
Est. Value
About This Home
This home is located at 2330 S 26th Rd, Ballantine, MT 59006 and is currently estimated at $520,775, approximately $261 per square foot. 2330 S 26th Rd is a home located in Yellowstone County with nearby schools including Huntley Project Elementary School, Huntley Project Junior High School, and Huntley Project High School.
Ownership History
Date
Name
Owned For
Owner Type
Purchase Details
Closed on
Dec 5, 2025
Sold by
Carney Cherri and Carney Cherri Jean
Bought by
Simons Cory A and Vandemoere Katelynn
Current Estimated Value
Purchase Details
Closed on
Feb 22, 2008
Sold by
Carney John P and Carney Cherri
Bought by
Carney John P and Carney Cherri
Home Financials for this Owner
Home Financials are based on the most recent Mortgage that was taken out on this home.
Original Mortgage
$168,000
Interest Rate
5.65%
Mortgage Type
Stand Alone Refi Refinance Of Original Loan
Create a Home Valuation Report for This Property
The Home Valuation Report is an in-depth analysis detailing your home's value as well as a comparison with similar homes in the area
Purchase History
| Date | Buyer | Sale Price | Title Company |
|---|---|---|---|
| Simons Cory A | -- | None Listed On Document | |
| Carney John P | -- | Servicelink |
Source: Public Records
Mortgage History
| Date | Status | Borrower | Loan Amount |
|---|---|---|---|
| Previous Owner | Carney John P | $168,000 |
Source: Public Records
Tax History
| Year | Tax Paid | Tax Assessment Tax Assessment Total Assessment is a certain percentage of the fair market value that is determined by local assessors to be the total taxable value of land and additions on the property. | Land | Improvement |
|---|---|---|---|---|
| 2025 | $2,499 | $465,700 | $178,583 | $287,117 |
| 2024 | $2,499 | $347,600 | $121,248 | $226,352 |
| 2023 | $2,955 | $347,600 | $121,248 | $226,352 |
| 2022 | $2,208 | $291,600 | $0 | $0 |
| 2021 | $2,679 | $291,600 | $0 | $0 |
| 2020 | $2,498 | $263,800 | $0 | $0 |
| 2019 | $2,442 | $263,800 | $0 | $0 |
| 2018 | $2,448 | $248,000 | $0 | $0 |
| 2017 | $2,413 | $248,000 | $0 | $0 |
| 2016 | $2,138 | $235,900 | $0 | $0 |
| 2015 | $2,275 | $235,900 | $0 | $0 |
| 2014 | $1,758 | $91,372 | $0 | $0 |
Source: Public Records
Map
Nearby Homes