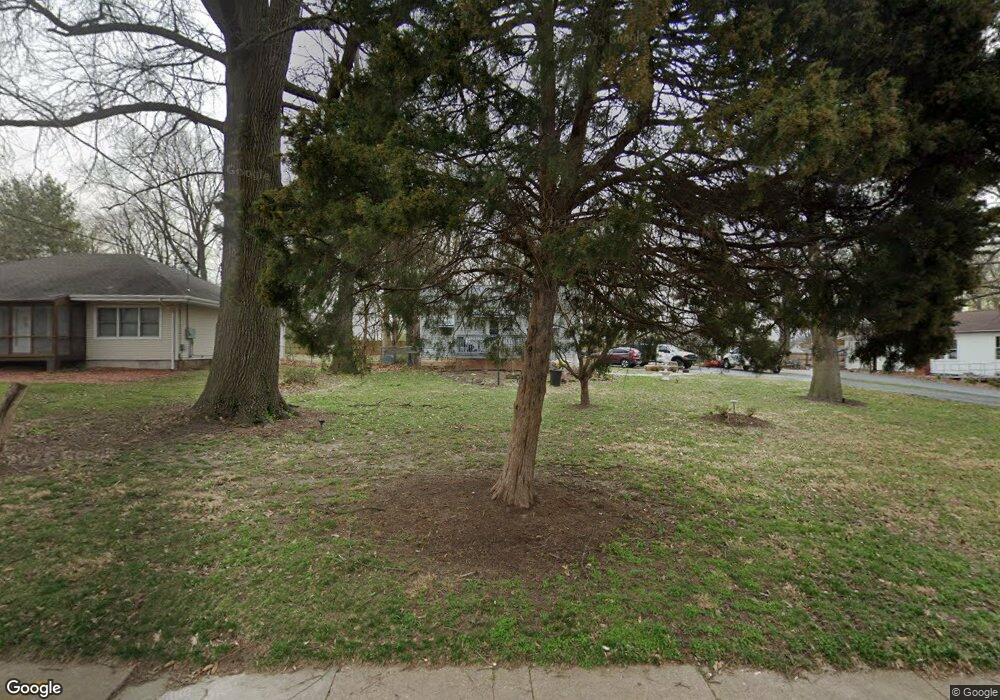
2330 Spencer Ave Saint Louis, MO 63114
Estimated Value: $133,924 - $141,000
2
Beds
1
Bath
960
Sq Ft
$142/Sq Ft
Est. Value
About This Home
This home is located at 2330 Spencer Ave, Saint Louis, MO 63114 and is currently estimated at $135,981, approximately $141 per square foot. 2330 Spencer Ave is a home located in St. Louis County with nearby schools including Iveland Elementary School, Hoech Middle School, and Ritenour Senior High School.
Ownership History
Date
Name
Owned For
Owner Type
Purchase Details
Closed on
Mar 5, 2008
Sold by
Scrima Russell G and Scrima Ligaya
Bought by
Scrima Russell G and Scrima Ligaya
Current Estimated Value
Home Financials for this Owner
Home Financials are based on the most recent Mortgage that was taken out on this home.
Original Mortgage
$88,000
Outstanding Balance
$54,616
Interest Rate
5.67%
Mortgage Type
Purchase Money Mortgage
Estimated Equity
$81,365
Purchase Details
Closed on
Feb 20, 2001
Sold by
Emmendorfer Matthew J and Emmendorfer Lisa J
Bought by
Scrima Russell G
Home Financials for this Owner
Home Financials are based on the most recent Mortgage that was taken out on this home.
Original Mortgage
$62,000
Interest Rate
6.85%
Create a Home Valuation Report for This Property
The Home Valuation Report is an in-depth analysis detailing your home's value as well as a comparison with similar homes in the area
Home Values in the Area
Average Home Value in this Area
Purchase History
| Date | Buyer | Sale Price | Title Company |
|---|---|---|---|
| Scrima Russell G | -- | Tri | |
| Scrima Russell G | $62,000 | Capital Title | |
| Scrima Russell G | -- | Capital Title |
Source: Public Records
Mortgage History
| Date | Status | Borrower | Loan Amount |
|---|---|---|---|
| Open | Scrima Russell G | $88,000 | |
| Closed | Scrima Russell G | $62,000 |
Source: Public Records
Tax History Compared to Growth
Tax History
| Year | Tax Paid | Tax Assessment Tax Assessment Total Assessment is a certain percentage of the fair market value that is determined by local assessors to be the total taxable value of land and additions on the property. | Land | Improvement |
|---|---|---|---|---|
| 2025 | $1,728 | $26,170 | $9,580 | $16,590 |
| 2024 | $1,728 | $20,120 | $2,870 | $17,250 |
| 2023 | $1,690 | $20,120 | $2,870 | $17,250 |
| 2022 | $1,566 | $16,340 | $2,870 | $13,470 |
| 2021 | $1,566 | $16,340 | $2,870 | $13,470 |
| 2020 | $1,607 | $15,480 | $3,720 | $11,760 |
| 2019 | $1,591 | $15,480 | $3,720 | $11,760 |
| 2018 | $1,396 | $12,200 | $3,400 | $8,800 |
| 2017 | $1,332 | $12,200 | $3,400 | $8,800 |
| 2016 | $1,228 | $11,440 | $3,400 | $8,040 |
| 2015 | $1,255 | $11,440 | $3,400 | $8,040 |
| 2014 | $1,719 | $16,040 | $3,670 | $12,370 |
Source: Public Records
Map
Nearby Homes
- 2326 Hood Ave
- 2321 Dawes Place
- 9531 Marlowe Ave
- 9515 Marlowe Ave
- 2242 Huntington Ave
- 2528 Leslie Ave
- 2527 Leslie Ave
- 9640 Tennyson Ave
- 2529 Leslie Ave
- 2432 Chaucer Ave
- 9623 Theodosia Ave
- 9518 Cote Brilliante Ave
- 10005 Pebble Beach Dr
- 2436 Pinehurst Dr
- 2709 W Tennyson Ave
- 10107 Niblic Dr
- 10111 Niblic Dr
- 2360 Goodale Ave
- 9604 Ridge Ave
- 9911 Dennison Ave
- 2328 Spencer Ave
- 2332 Spencer Ave
- 2324 Spencer Ave
- 2336 Spencer Ave
- 2335 Spencer Ave
- 2333 Spencer Ave
- 2322 Spencer Ave
- 2335 Hood Ave
- 2331 Hood Ave
- 2329 Spencer Ave
- 2337 Spencer Ave
- 2337 Hood Ave
- 2329 Hood Ave
- 2327 Spencer Ave
- 2325 Hood Ave
- 2320 Spencer Ave
- 2325 Spencer Ave
- 2341 Spencer Ave
- 2323 Spencer Ave
- 2333 Hood Ave