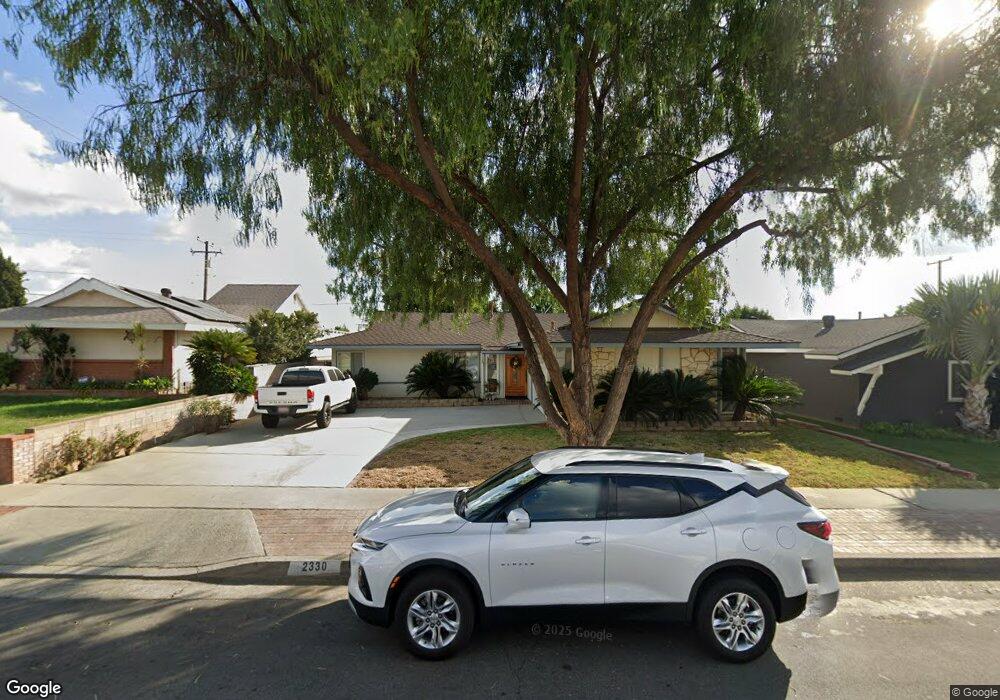
2330 Walling Ave La Habra, CA 90631
Estimated Value: $831,000 - $1,077,000
3
Beds
2
Baths
1,272
Sq Ft
$720/Sq Ft
Est. Value
About This Home
This home is located at 2330 Walling Ave, La Habra, CA 90631 and is currently estimated at $915,969, approximately $720 per square foot. 2330 Walling Ave is a home located in Orange County with nearby schools including Sierra Vista Elementary School, Ladera Palma Elementary School, and Washington Middle School.
Ownership History
Date
Name
Owned For
Owner Type
Purchase Details
Closed on
Feb 20, 2021
Sold by
Whitlock Amy K
Bought by
Galigher Kerri and Whitlock Amy K
Current Estimated Value
Home Financials for this Owner
Home Financials are based on the most recent Mortgage that was taken out on this home.
Original Mortgage
$352,500
Outstanding Balance
$315,814
Interest Rate
2.8%
Mortgage Type
New Conventional
Estimated Equity
$600,155
Purchase Details
Closed on
Aug 12, 2009
Sold by
Whitlock Kristi L V
Bought by
Whitlock Amy K
Purchase Details
Closed on
Mar 4, 2008
Sold by
Whitlock Amy K and Whitlock Kristi L V
Bought by
Whitlock Amy K and Whitlock Kristi L
Home Financials for this Owner
Home Financials are based on the most recent Mortgage that was taken out on this home.
Original Mortgage
$392,000
Interest Rate
6%
Mortgage Type
New Conventional
Purchase Details
Closed on
Feb 2, 2000
Sold by
Rollins James K and Rollins David K
Bought by
Whitlock Amy K and Valentine Kristi L
Home Financials for this Owner
Home Financials are based on the most recent Mortgage that was taken out on this home.
Original Mortgage
$194,750
Interest Rate
8.26%
Create a Home Valuation Report for This Property
The Home Valuation Report is an in-depth analysis detailing your home's value as well as a comparison with similar homes in the area
Home Values in the Area
Average Home Value in this Area
Purchase History
| Date | Buyer | Sale Price | Title Company |
|---|---|---|---|
| Galigher Kerri | -- | Stewart Title Guaranty Co | |
| Whitlock Amy K | -- | None Available | |
| Whitlock Amy K | -- | Equity Title Company | |
| Whitlock Amy K | $205,000 | Southland Title Corporation |
Source: Public Records
Mortgage History
| Date | Status | Borrower | Loan Amount |
|---|---|---|---|
| Open | Galigher Kerri | $352,500 | |
| Closed | Whitlock Amy K | $392,000 | |
| Closed | Whitlock Amy K | $194,750 |
Source: Public Records
Tax History Compared to Growth
Tax History
| Year | Tax Paid | Tax Assessment Tax Assessment Total Assessment is a certain percentage of the fair market value that is determined by local assessors to be the total taxable value of land and additions on the property. | Land | Improvement |
|---|---|---|---|---|
| 2025 | $3,748 | $315,067 | $231,295 | $83,772 |
| 2024 | $3,748 | $308,890 | $226,760 | $82,130 |
| 2023 | $3,660 | $302,834 | $222,314 | $80,520 |
| 2022 | $3,620 | $296,897 | $217,955 | $78,942 |
| 2021 | $3,562 | $291,076 | $213,681 | $77,395 |
| 2020 | $3,528 | $288,092 | $211,490 | $76,602 |
| 2019 | $3,434 | $282,444 | $207,344 | $75,100 |
| 2018 | $3,377 | $276,906 | $203,278 | $73,628 |
| 2017 | $3,318 | $271,477 | $199,292 | $72,185 |
| 2016 | $3,241 | $266,154 | $195,384 | $70,770 |
| 2015 | $3,150 | $262,157 | $192,450 | $69,707 |
| 2014 | $3,058 | $257,022 | $188,680 | $68,342 |
Source: Public Records
Map
Nearby Homes
- 1508 Mccart Ave
- 1414 W Central Ave Unit 88
- 1261 Glen Lake Ave Unit 279
- 755 Village Lake Mall Unit 337
- 1506 Bergman Ct
- 1223 El Encanto Dr
- 1341 Harbor Lake Ave Unit 24
- 1663 Gatewood Ct
- 686 Wood Lake Dr Unit 8
- 1318 Alta Mesa Dr
- 410 N Fonda St
- 1371 Pleasant Lake Place Unit 105
- 1936 Skywood St
- 2201 Lake View Dr Unit 20
- 620 Lake Ridge Way Unit 45
- 2121 Lake Side Dr Unit 158
- 551 Lake Grove Way Unit 165
- 224 S Fonda St
- 1400 Eastpark Dr
- 521 Forest Lake Dr Unit 64
- 1506 Walling Ave
- 2320 Walling Ave
- 2310 Walling Ave
- 1500 Walling Ave
- 2351 Mccart Ave
- 2341 Mccart Ave
- 1509 Mccart Ave
- 905 Mccart Cir
- 2300 Walling Ave
- 1501 Walling Ave
- 2331 Mccart Ave
- 1422 Walling Ave
- 2321 Walling Ave
- 909 Mccart Cir
- 2311 Walling Ave
- 2321 Mccart Ave
- 1503 Mccart Ave
- 2250 Walling Ave
- 1005 Delay St
- 2301 Walling Ave