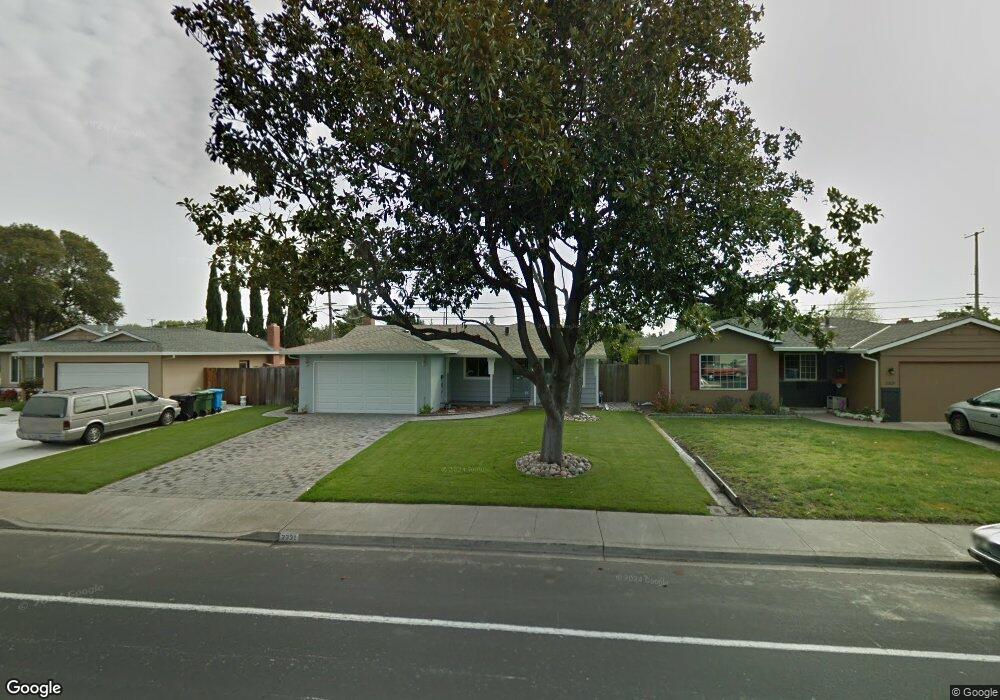
2331 Bowers Ave Santa Clara, CA 95051
Estimated Value: $1,611,000 - $1,808,009
3
Beds
2
Baths
1,207
Sq Ft
$1,443/Sq Ft
Est. Value
About This Home
This home is located at 2331 Bowers Ave, Santa Clara, CA 95051 and is currently estimated at $1,741,252, approximately $1,442 per square foot. 2331 Bowers Ave is a home located in Santa Clara County with nearby schools including Bracher Elementary School, Juan Cabrillo Middle School, and Adrian Wilcox High School.
Ownership History
Date
Name
Owned For
Owner Type
Purchase Details
Closed on
Jun 9, 2014
Sold by
Hernandez Arnulfo C and Gomez Guardado Maria G
Bought by
Hernandez Arnulfo C and Gomez Guardado Maria G
Current Estimated Value
Home Financials for this Owner
Home Financials are based on the most recent Mortgage that was taken out on this home.
Original Mortgage
$500,000
Outstanding Balance
$379,738
Interest Rate
4.16%
Mortgage Type
New Conventional
Estimated Equity
$1,361,514
Purchase Details
Closed on
Mar 30, 2011
Sold by
Tacey Gary R and Tacey Wanda E
Bought by
Hernandez Arnulfo and Guardado Maria Gomez
Home Financials for this Owner
Home Financials are based on the most recent Mortgage that was taken out on this home.
Original Mortgage
$506,818
Interest Rate
4.87%
Mortgage Type
FHA
Create a Home Valuation Report for This Property
The Home Valuation Report is an in-depth analysis detailing your home's value as well as a comparison with similar homes in the area
Home Values in the Area
Average Home Value in this Area
Purchase History
| Date | Buyer | Sale Price | Title Company |
|---|---|---|---|
| Hernandez Arnulfo C | -- | First American Title Company | |
| Hernandez Arnulfo | $520,000 | Chicago Title Company |
Source: Public Records
Mortgage History
| Date | Status | Borrower | Loan Amount |
|---|---|---|---|
| Open | Hernandez Arnulfo C | $500,000 | |
| Closed | Hernandez Arnulfo | $506,818 |
Source: Public Records
Tax History Compared to Growth
Tax History
| Year | Tax Paid | Tax Assessment Tax Assessment Total Assessment is a certain percentage of the fair market value that is determined by local assessors to be the total taxable value of land and additions on the property. | Land | Improvement |
|---|---|---|---|---|
| 2025 | $7,649 | $666,200 | $532,963 | $133,237 |
| 2024 | $7,649 | $653,138 | $522,513 | $130,625 |
| 2023 | $7,570 | $640,332 | $512,268 | $128,064 |
| 2022 | $7,444 | $627,777 | $502,224 | $125,553 |
| 2021 | $7,412 | $615,469 | $492,377 | $123,092 |
| 2020 | $7,277 | $609,159 | $487,329 | $121,830 |
| 2019 | $7,266 | $597,216 | $477,774 | $119,442 |
| 2018 | $6,800 | $585,506 | $468,406 | $117,100 |
| 2017 | $6,765 | $574,026 | $459,222 | $114,804 |
| 2016 | $6,641 | $562,771 | $450,218 | $112,553 |
| 2015 | $6,614 | $554,319 | $443,456 | $110,863 |
| 2014 | $6,281 | $543,462 | $434,770 | $108,692 |
Source: Public Records
Map
Nearby Homes
- 2191 Bowers Ave
- 2576 Knightsbridge Ln
- 2468 Poett Ln
- 3050 Machado Ave
- 2516 Parkland Ct
- 2514 Parkland Ct
- 2028 Staats Way
- 2038 Kington Place
- 2250 Monroe St Unit 201
- 2250 Monroe St Unit 238
- 2331 Castro Place
- 2272 Cabrillo Ave
- 2171 Rancho Mccormick Blvd
- 2201 Monroe St Unit 102
- 2105 Rancho Mccormick Blvd
- 2150 Menzel Place
- 3079 El Camino Real Unit 101
- 3079 El Camino Real Unit 205
- 3079 El Camino Real Unit 202
- 3089 El Camino Real Unit 9
- 2321 Bowers Ave
- 2341 Bowers Ave
- 2368 Dundee Dr
- 2358 Dundee Dr
- 2311 Bowers Ave
- 2378 Dundee Dr
- 2348 Dundee Dr
- 2714 Bonnie Dr
- 2301 Bowers Ave
- 2338 Dundee Dr
- 2332 Bowers Ave
- 2695 Bonnie Dr
- 2685 Bonnie Dr
- 2322 Bowers Ave
- 2724 Bonnie Dr
- 2291 Bowers Ave
- 2705 Bonnie Dr
- 2328 Dundee Dr
- 2664 Bonnie Dr
- 2675 Bonnie Dr