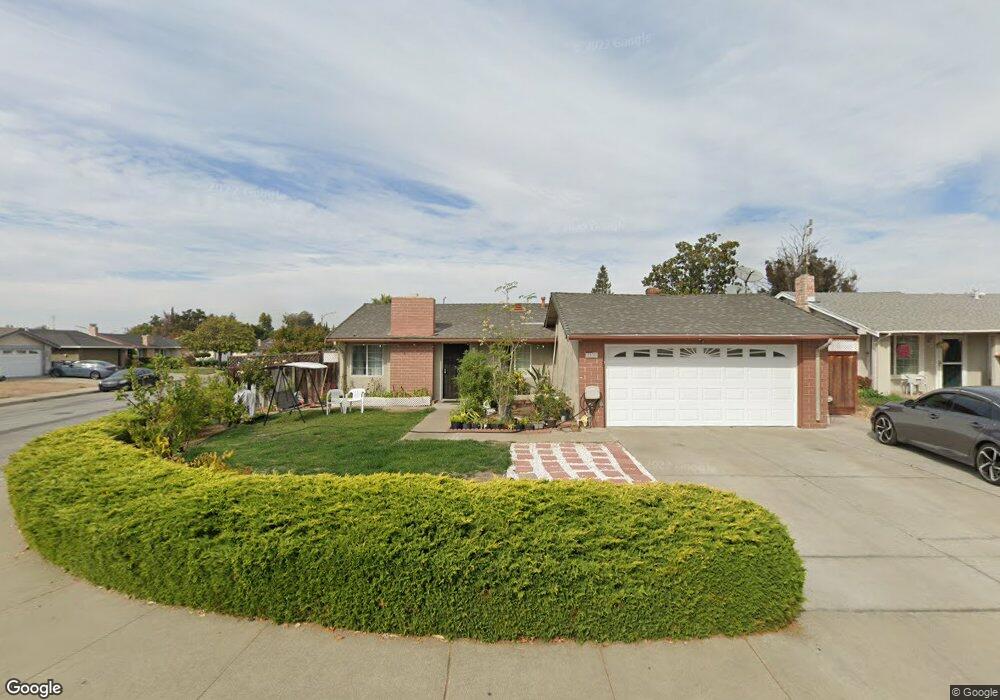
2331 Brushglen Way San Jose, CA 95133
Commodore NeighborhoodEstimated Value: $991,000 - $1,251,000
3
Beds
2
Baths
1,041
Sq Ft
$1,107/Sq Ft
Est. Value
About This Home
This home is located at 2331 Brushglen Way, San Jose, CA 95133 and is currently estimated at $1,151,924, approximately $1,106 per square foot. 2331 Brushglen Way is a home located in Santa Clara County with nearby schools including Ben Painter Elementary School, William Sheppard Middle School, and Independence High School.
Ownership History
Date
Name
Owned For
Owner Type
Purchase Details
Closed on
Feb 10, 2005
Sold by
Somejo Rhod S and Somejo Susan Teresita R
Bought by
Somejo Rhod S and Somejo Susana Teresita R
Current Estimated Value
Home Financials for this Owner
Home Financials are based on the most recent Mortgage that was taken out on this home.
Original Mortgage
$350,000
Outstanding Balance
$178,367
Interest Rate
5.79%
Mortgage Type
New Conventional
Estimated Equity
$973,557
Purchase Details
Closed on
Mar 23, 2001
Sold by
Somejo Rhod S and Somejo Susana Teresita R
Bought by
Somejo Rhod S and Somejo Susana Teresita R
Home Financials for this Owner
Home Financials are based on the most recent Mortgage that was taken out on this home.
Original Mortgage
$275,000
Interest Rate
7.06%
Purchase Details
Closed on
Feb 13, 1997
Sold by
Somejo Loreto J and Somejo Maria S
Bought by
Somejo Rhod S and Somejo Susana Teresita R
Purchase Details
Closed on
Dec 27, 1994
Sold by
Vanle Aaron and Huynh Giau T
Bought by
Somejo Rhod S and Somejo Susana Teresita R
Home Financials for this Owner
Home Financials are based on the most recent Mortgage that was taken out on this home.
Original Mortgage
$184,300
Interest Rate
9.87%
Create a Home Valuation Report for This Property
The Home Valuation Report is an in-depth analysis detailing your home's value as well as a comparison with similar homes in the area
Home Values in the Area
Average Home Value in this Area
Purchase History
| Date | Buyer | Sale Price | Title Company |
|---|---|---|---|
| Somejo Rhod S | -- | Old Republic Title Company | |
| Somejo Rhod S | -- | Financial Title Company | |
| Somejo Rhod S | -- | -- | |
| Somejo Rhod S | $194,000 | Valley Title Company |
Source: Public Records
Mortgage History
| Date | Status | Borrower | Loan Amount |
|---|---|---|---|
| Open | Somejo Rhod S | $350,000 | |
| Closed | Somejo Rhod S | $275,000 | |
| Closed | Somejo Rhod S | $184,300 |
Source: Public Records
Tax History Compared to Growth
Tax History
| Year | Tax Paid | Tax Assessment Tax Assessment Total Assessment is a certain percentage of the fair market value that is determined by local assessors to be the total taxable value of land and additions on the property. | Land | Improvement |
|---|---|---|---|---|
| 2025 | $5,849 | $325,829 | $134,361 | $191,468 |
| 2024 | $5,849 | $319,441 | $131,727 | $187,714 |
| 2023 | $5,710 | $313,179 | $129,145 | $184,034 |
| 2022 | $5,603 | $307,039 | $126,613 | $180,426 |
| 2021 | $5,393 | $301,020 | $124,131 | $176,889 |
| 2020 | $5,261 | $297,935 | $122,859 | $175,076 |
| 2019 | $5,109 | $292,094 | $120,450 | $171,644 |
| 2018 | $5,031 | $286,368 | $118,089 | $168,279 |
| 2017 | $5,032 | $280,754 | $115,774 | $164,980 |
| 2016 | $4,754 | $275,250 | $113,504 | $161,746 |
| 2015 | $4,740 | $271,117 | $111,800 | $159,317 |
| 2014 | $4,266 | $265,807 | $109,610 | $156,197 |
Source: Public Records
Map
Nearby Homes
- 370 Englert Ct
- 2420 Kita Ln
- 2432 Kita Ln
- 559 Apricot Way
- 571 Apricot Way
- 2580 Gimelli Way
- 750 Fruit Ranch Loop
- 633 Easton Dr
- 2599 Easton Ln Unit 108
- 2599 Easton Ln Unit 109
- 2623 Gimelli Place Unit 139
- 709 Whitewater Ct Unit 44
- 230 Montclair Ave
- 674 Galleon Ct
- 2369 Mabury Rd
- 259 N Capitol Ave Unit 171
- 259 N Capitol Ave Unit 131
- 259 N Capitol Ave Unit 116
- 12280 Mabury Rd
- 210 Damsen Dr Unit 22
- 2335 Brushglen Way
- 2354 Ridgeglen Way
- 2358 Ridgeglen Way
- 2339 Brushglen Way
- 2398 Ashglen Way
- 2362 Ridgeglen Way
- 547 Downsglen Way
- 2392 Ashglen Way
- 2346 Brushglen Way
- 2386 Ashglen Way
- 2343 Brushglen Way
- 2342 Brushglen Way
- 2366 Ridgeglen Way
- 543 Downsglen Way
- 2323 Brushglen Way
- 2382 Ashglen Way
- 2347 Brushglen Way
- 546 Downsglen Way
- 2370 Ridgeglen Way
- 2355 Ridgeglen Way