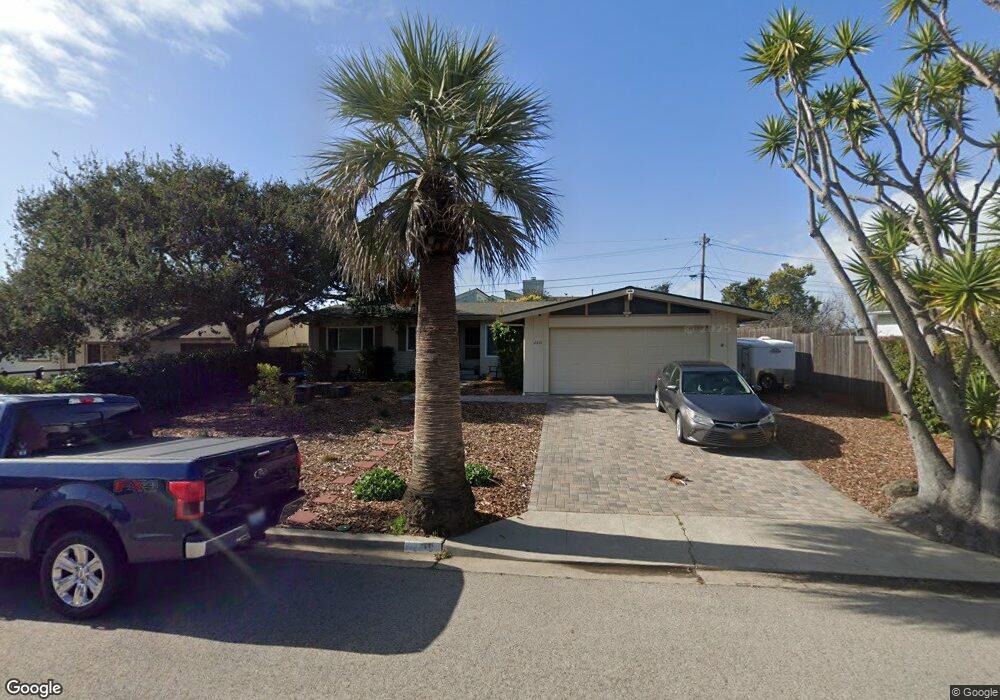
2331 Crest Ave Los Osos, CA 93402
Estimated Value: $813,423 - $1,049,000
3
Beds
2
Baths
1,300
Sq Ft
$709/Sq Ft
Est. Value
About This Home
This home is located at 2331 Crest Ave, Los Osos, CA 93402 and is currently estimated at $922,106, approximately $709 per square foot. 2331 Crest Ave is a home located in San Luis Obispo County with nearby schools including Monarch Grove Elementary School, Los Osos Middle School, and Morro Bay High School.
Ownership History
Date
Name
Owned For
Owner Type
Purchase Details
Closed on
Jun 14, 2012
Sold by
Johnson Glen H and Johnson Ruth A
Bought by
Johnson Glen H and Johnson Ruth A
Current Estimated Value
Home Financials for this Owner
Home Financials are based on the most recent Mortgage that was taken out on this home.
Original Mortgage
$200,000
Outstanding Balance
$136,839
Interest Rate
3.56%
Mortgage Type
New Conventional
Estimated Equity
$785,267
Purchase Details
Closed on
Oct 18, 2007
Sold by
Johnson Glen H and Johnson Ruth A
Bought by
Johnson Glen H and Johnson Ruth A
Purchase Details
Closed on
Jun 14, 2001
Sold by
Alfirevic Robert G
Bought by
Johnson Glen H and Johnson Ruth A
Home Financials for this Owner
Home Financials are based on the most recent Mortgage that was taken out on this home.
Original Mortgage
$288,000
Interest Rate
7.15%
Purchase Details
Closed on
Nov 24, 1998
Sold by
Alfirevic Robert G
Bought by
Alfirevic Robert G
Purchase Details
Closed on
Nov 17, 1997
Sold by
Bowerman Virginia A L and Lahey James A
Bought by
Alfirevic Robert G
Create a Home Valuation Report for This Property
The Home Valuation Report is an in-depth analysis detailing your home's value as well as a comparison with similar homes in the area
Home Values in the Area
Average Home Value in this Area
Purchase History
| Date | Buyer | Sale Price | Title Company |
|---|---|---|---|
| Johnson Glen H | -- | Fidelity National Title | |
| Johnson Glen H | -- | None Available | |
| Johnson Glen H | $360,000 | Chicago Title Co | |
| Alfirevic Robert G | -- | -- | |
| Alfirevic Robert G | -- | Fidelity National Title Co | |
| Alfirevic Robert G | $160,000 | Fidelity National Title Co |
Source: Public Records
Mortgage History
| Date | Status | Borrower | Loan Amount |
|---|---|---|---|
| Open | Johnson Glen H | $200,000 | |
| Previous Owner | Johnson Glen H | $288,000 |
Source: Public Records
Tax History Compared to Growth
Tax History
| Year | Tax Paid | Tax Assessment Tax Assessment Total Assessment is a certain percentage of the fair market value that is determined by local assessors to be the total taxable value of land and additions on the property. | Land | Improvement |
|---|---|---|---|---|
| 2025 | $8,675 | $531,803 | $251,127 | $280,676 |
| 2024 | $8,366 | $521,376 | $246,203 | $275,173 |
| 2023 | $8,366 | $511,154 | $241,376 | $269,778 |
| 2022 | $8,017 | $501,133 | $236,644 | $264,489 |
| 2021 | $8,014 | $491,307 | $232,004 | $259,303 |
| 2020 | $7,600 | $486,271 | $229,626 | $256,645 |
| 2019 | $7,497 | $476,737 | $225,124 | $251,613 |
| 2018 | $7,377 | $467,390 | $220,710 | $246,680 |
| 2017 | $7,356 | $458,227 | $216,383 | $241,844 |
| 2016 | $5,864 | $449,243 | $212,141 | $237,102 |
| 2015 | $5,720 | $436,000 | $205,000 | $231,000 |
| 2014 | $5,192 | $414,000 | $195,000 | $219,000 |
Source: Public Records
Map
Nearby Homes
- 1299 Bay Oaks Dr
- 1301 Los Osos Valley Rd
- 1210 Bayview Heights Dr
- 1039 Bayview Heights Dr
- 1421 Las Encinas Dr
- 0 Vista Del Osos
- 1230 Los Olivos Ave
- 2495 Tierra Dr
- 1250 Los Olivos Ave
- 781 Los Osos Valley Rd
- 2021 9th St
- 1675 Los Osos Valley Rd Unit 217
- 1606 Valley View Dr
- 1701 Los Osos Valley Rd Unit 28
- 532 Mar Vista Dr
- 971 Ramona Ave
- 1231 10th St
- 1266 10th St
- 0 9th St
- 1630 13th St
- 2345 Crest Ave
- 2315 Crest Ave
- 2330 Claranita Ave
- 2320 Claranita Ave
- 2340 Claranita Ave
- 1210 Del Mar Dr
- 2361 Crest Ave
- 1199 Bay Oaks Dr
- 1161 Bay Oaks Dr
- 2360 Claranita Ave Unit 1
- 2350 Crest Ave
- 2310 Crest Ave
- 2375 Crest Ave
- 2321 Claranita Ave
- 1230 Del Mar Dr
- 2341 Claranita Ave
- 2380 Claranita Ave
- 2321 Clarinita Ave
- 1215 Del Mar Dr
- 1205 Bay Oaks Dr