2332 Highview Trail Vista, CA 92084
Vista Valley NeighborhoodEstimated Value: $1,037,646 - $1,631,000
4
Beds
3
Baths
2,352
Sq Ft
$530/Sq Ft
Est. Value
About This Home
This home is located at 2332 Highview Trail, Vista, CA 92084 and is currently estimated at $1,246,412, approximately $529 per square foot. 2332 Highview Trail is a home located in San Diego County with nearby schools including Hannalei Elementary School, Rancho Minerva Middle School, and Rancho Buena Vista High School.
Ownership History
Date
Name
Owned For
Owner Type
Purchase Details
Closed on
Feb 23, 2012
Sold by
Dawson Investments Llc
Bought by
Dawson Chad
Current Estimated Value
Purchase Details
Closed on
Nov 11, 2010
Sold by
Dawson Chad
Bought by
Dawson Investments Llc
Purchase Details
Closed on
Nov 20, 2009
Sold by
Dawson Jennifer Messera
Bought by
Dawson Chad
Purchase Details
Closed on
Mar 25, 2008
Sold by
Sur Roger Lu
Bought by
Sur Roger Lu
Purchase Details
Closed on
Sep 14, 2007
Sold by
Sur Douglas Young and Sur Roger Lu
Bought by
Sur Roger Lu
Purchase Details
Closed on
Aug 27, 2002
Sold by
Sur Jacob D Y
Bought by
Sur Jacob D Y
Purchase Details
Closed on
Oct 15, 1996
Sold by
Sur Maureen Mei Ling
Bought by
Sur Jacob D Y
Purchase Details
Closed on
Jul 11, 1996
Sold by
Bauder and Cheryl
Bought by
Sur Jacob D Y and Sur Maureen Mei Ling
Create a Home Valuation Report for This Property
The Home Valuation Report is an in-depth analysis detailing your home's value as well as a comparison with similar homes in the area
Home Values in the Area
Average Home Value in this Area
Purchase History
| Date | Buyer | Sale Price | Title Company |
|---|---|---|---|
| Dawson Chad | -- | None Available | |
| Dawson Investments Llc | -- | None Available | |
| Dawson Chad | -- | First American Title | |
| Dawson Chad | $460,000 | First American Title | |
| Sur Roger Lu | -- | First American Title | |
| Sur Roger Lu | -- | None Available | |
| Sur Roger Lu | -- | None Available | |
| Sur Jacob D Y | -- | -- | |
| Sur Jacob D Y | -- | -- | |
| Sur Jacob D Y | $265,000 | Fidelity National Title |
Source: Public Records
Tax History Compared to Growth
Tax History
| Year | Tax Paid | Tax Assessment Tax Assessment Total Assessment is a certain percentage of the fair market value that is determined by local assessors to be the total taxable value of land and additions on the property. | Land | Improvement |
|---|---|---|---|---|
| 2025 | $6,907 | $593,767 | $302,484 | $291,283 |
| 2024 | $6,907 | $582,125 | $296,553 | $285,572 |
| 2023 | $6,754 | $570,712 | $290,739 | $279,973 |
| 2022 | $6,737 | $559,523 | $285,039 | $274,484 |
| 2021 | $6,604 | $548,552 | $279,450 | $269,102 |
| 2020 | $6,663 | $542,928 | $276,585 | $266,343 |
| 2019 | $6,577 | $532,283 | $271,162 | $261,121 |
| 2018 | $6,283 | $521,847 | $265,846 | $256,001 |
| 2017 | $960 | $511,616 | $260,634 | $250,982 |
| 2016 | $6,058 | $501,585 | $255,524 | $246,061 |
| 2015 | $6,030 | $494,051 | $251,686 | $242,365 |
| 2014 | $5,896 | $484,374 | $246,756 | $237,618 |
Source: Public Records
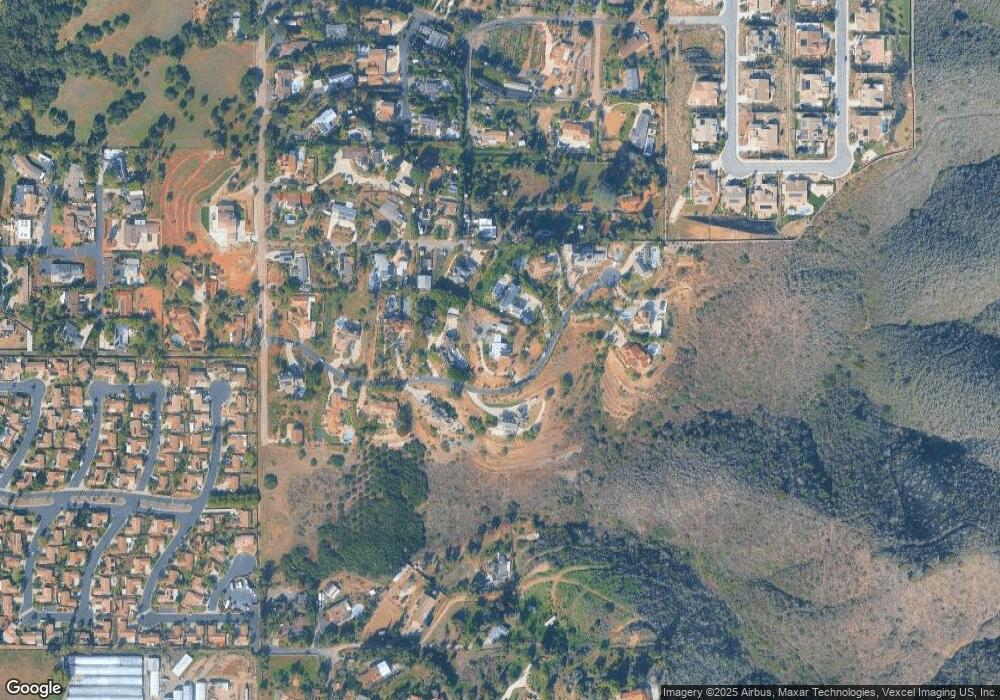
Map
Nearby Homes
- 1628 Lone Oak Rd
- 1525 Manzanita Hollow
- 2112 Savona Ct
- 1564 Manzanita Hollow
- 1932 Victory Dr
- 2050 Buena Village Dr
- 2511 Entrada Ave
- 325 Estrelita Dr
- 1 Esplendido Ave
- 2528 Bella Vista Dr
- 1373 Topanga Dr
- 901 Cayley Ave
- 891 Cayley Ave
- 873 Cayley Ave
- 000 Primrose & Lobelia
- 1739 Montgomery Dr
- 1624 Siddall Dr
- 951 Visalia Place
- 982 Woodhaven Rd
- 1520 Sunbury Ct
- 2350 Highview Trail
- 2274 Highview Trail
- 2305 Highview Trail
- 2368 Highview Trail
- 1674 Lone Oak Rd
- 2271 Highview Trail
- 2258 Highview Trail
- 1664 Lone Oak Rd
- 2390 Highview Trail
- 2390-92 Highview Trail
- 1668 Lone Oak Rd
- 2253 Highview Trail
- 2369 Highview Trail
- 1678 Lone Oak Rd
- 2383 Highview Trail
- 2226 Highview Trail
- 2387 Highview Trail
- 1660 Lone Oak Rd
- 1658 Lone Oak Rd
- 2239 Highview Trail