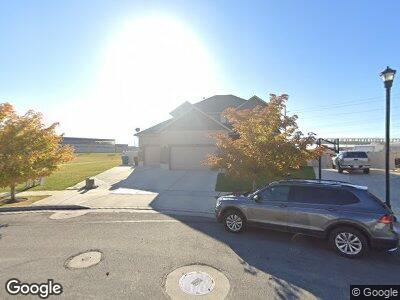
2332 S 2205 W Unit CU-340 Woods Cross, UT 84087
Estimated Value: $763,000 - $823,000
4
Beds
3
Baths
3,852
Sq Ft
$206/Sq Ft
Est. Value
About This Home
This home is located at 2332 S 2205 W Unit CU-340, Woods Cross, UT 84087 and is currently estimated at $792,323, approximately $205 per square foot. 2332 S 2205 W Unit CU-340 is a home located in Davis County with nearby schools including Odyssey School, Mueller Park Junior High School, and Bountiful High School.
Ownership History
Date
Name
Owned For
Owner Type
Purchase Details
Closed on
Dec 13, 2012
Sold by
Shephered Daniel and Shephered Shannon
Bought by
Brown Garrett W and Brown Trudi L
Current Estimated Value
Home Financials for this Owner
Home Financials are based on the most recent Mortgage that was taken out on this home.
Original Mortgage
$299,475
Interest Rate
2.75%
Mortgage Type
FHA
Purchase Details
Closed on
Jun 29, 2010
Sold by
Shepherd Daniel
Bought by
Shepherd Daniel and Shepherd Shannon
Purchase Details
Closed on
Mar 24, 2010
Sold by
Valentine Estates Llc
Bought by
Candlelight Homes Llc
Home Financials for this Owner
Home Financials are based on the most recent Mortgage that was taken out on this home.
Original Mortgage
$80,000
Interest Rate
4.94%
Mortgage Type
Stand Alone Second
Create a Home Valuation Report for This Property
The Home Valuation Report is an in-depth analysis detailing your home's value as well as a comparison with similar homes in the area
Home Values in the Area
Average Home Value in this Area
Purchase History
| Date | Buyer | Sale Price | Title Company |
|---|---|---|---|
| Brown Garrett W | -- | Mountain View Title | |
| Shepherd Daniel | -- | Integrated Title Insurance | |
| Candlelight Homes Llc | -- | Integrated Title Ins Srv |
Source: Public Records
Mortgage History
| Date | Status | Borrower | Loan Amount |
|---|---|---|---|
| Open | Nelsen Robert W | $274,000 | |
| Closed | Brown Garrett W | $50,000 | |
| Closed | Brown Garrett W | $230,000 | |
| Closed | Brown Garrett W | $299,475 | |
| Previous Owner | Candlelight Homes Llc | $80,000 |
Source: Public Records
Tax History Compared to Growth
Tax History
| Year | Tax Paid | Tax Assessment Tax Assessment Total Assessment is a certain percentage of the fair market value that is determined by local assessors to be the total taxable value of land and additions on the property. | Land | Improvement |
|---|---|---|---|---|
| 2024 | $4,544 | $399,300 | $136,133 | $263,167 |
| 2023 | $4,370 | $711,000 | $182,878 | $528,122 |
| 2022 | $4,320 | $389,950 | $67,428 | $322,522 |
| 2021 | $3,755 | $536,000 | $99,904 | $436,096 |
| 2020 | $3,330 | $468,000 | $95,384 | $372,616 |
| 2019 | $3,439 | $477,000 | $87,907 | $389,093 |
| 2018 | $3,225 | $443,000 | $86,220 | $356,780 |
| 2016 | $2,987 | $221,155 | $46,841 | $174,314 |
| 2015 | $3,004 | $213,950 | $46,841 | $167,109 |
| 2014 | $2,645 | $191,009 | $46,841 | $144,168 |
| 2013 | -- | $155,652 | $29,201 | $126,451 |
Source: Public Records
Map
Nearby Homes
- 2084 W 2260 S
- 2304 S 2060 W
- 2102 S 2200 W
- 1022 Allington Dr
- 2094 S Mountain View Blvd
- 2277 S 1925 W
- 1888 W 2135 S
- 820 W 1100 N Unit 141
- 824 W 1100 N Unit 143
- 818 W 1100 N Unit 140
- 826 W 1100 N Unit 144
- 1036 Darcy Dr
- 922 Cambria Dr
- 806 W 1100 N Unit 134
- 810 W 1100 N Unit 136
- 816 W 1100 N Unit 139
- 812 W 1100 N Unit 137
- 1977 S 1825 W
- 842 W Pickering Dr
- 928 Amberly Dr
- 2332 S 2205 W Unit CU-340
- 2332 S 2205 W
- 2318 S 2205 W Unit CU-339
- 2306 S 2205 W
- 2309 S 2205 W
- 2316 S Mountain View Blvd Unit CU-323
- 2288 S 2205 W Unit CU-337
- 2288 S 2205 W
- 2308 S Mountain View Blvd Unit CU-322
- 2291 S 2205 W
- 2276 S 2205 W Unit CU-336
- 2294 S Mountain View Blvd Unit CU-321
- 2283 S 2205 W Unit CU327
- 2268 S 2205 W
- 2268 S 2205 W Unit CU-335
- 2313 S Mountain View Blvd Unit CU-308
- 2313 S Mountain View Blvd
- 2271 S 2205 W
- 2301 S Mountain View Blvd Unit CU-309
- 2262 S 2205 W