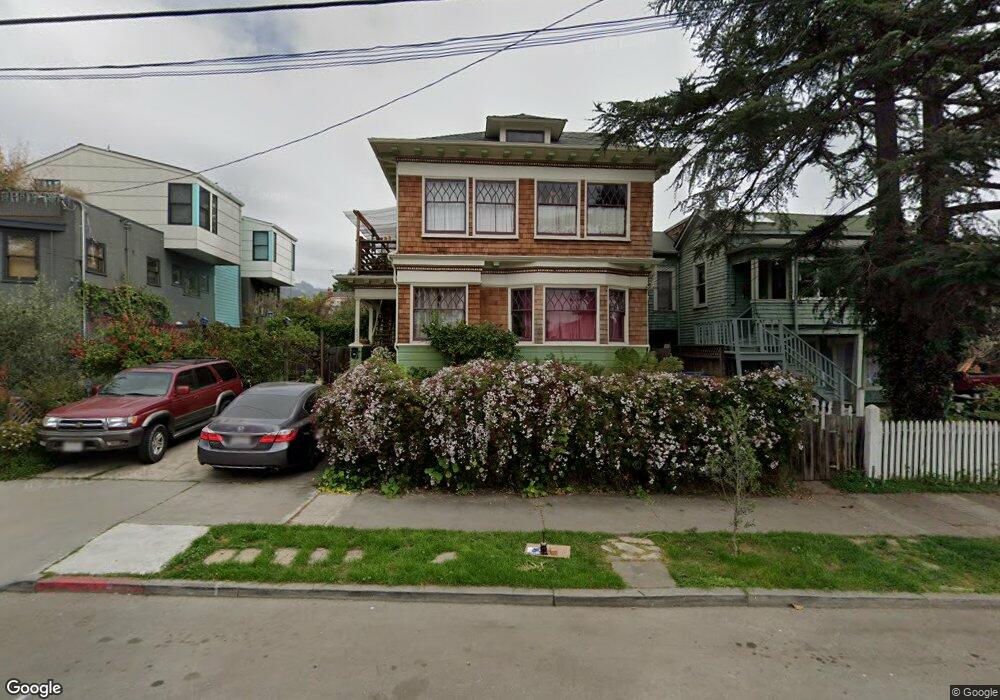
2333 Grant St Unit 2 Berkeley, CA 94703
Downtown Berkeley NeighborhoodEstimated Value: $646,000 - $1,198,000
3
Beds
25
Baths
1,536
Sq Ft
$644/Sq Ft
Est. Value
About This Home
This home is located at 2333 Grant St Unit 2, Berkeley, CA 94703 and is currently estimated at $988,805, approximately $643 per square foot. 2333 Grant St Unit 2 is a home located in Alameda County with nearby schools including Washington Elementary School, Berkeley Arts Magnet at Whittier School, and Malcolm X Elementary School.
Ownership History
Date
Name
Owned For
Owner Type
Purchase Details
Closed on
Oct 20, 2017
Sold by
Phillips Robert D and Child Tracy
Bought by
Phillips Robert D and Child Tracy
Current Estimated Value
Home Financials for this Owner
Home Financials are based on the most recent Mortgage that was taken out on this home.
Original Mortgage
$545,000
Interest Rate
3.83%
Mortgage Type
New Conventional
Purchase Details
Closed on
Mar 18, 2016
Sold by
Phillips Robert D and Child Tracy
Bought by
Phillips Robert D and Child Tracy
Home Financials for this Owner
Home Financials are based on the most recent Mortgage that was taken out on this home.
Original Mortgage
$417,000
Interest Rate
3.65%
Mortgage Type
New Conventional
Purchase Details
Closed on
Aug 21, 2015
Sold by
Phillips Robert D and Child Tracy
Bought by
The Robert Phillips & Tracy Child Living
Home Financials for this Owner
Home Financials are based on the most recent Mortgage that was taken out on this home.
Original Mortgage
$417,000
Interest Rate
3.97%
Mortgage Type
New Conventional
Purchase Details
Closed on
Jul 8, 2003
Sold by
Phillips Robert D and Child Tracy
Bought by
Phillips Robert D and Child Tracy
Home Financials for this Owner
Home Financials are based on the most recent Mortgage that was taken out on this home.
Original Mortgage
$300,000
Interest Rate
5.18%
Mortgage Type
Purchase Money Mortgage
Purchase Details
Closed on
Oct 24, 2002
Sold by
Phillips Robert D and Child Tracy
Bought by
Phillips Robert D and Child Tracy
Home Financials for this Owner
Home Financials are based on the most recent Mortgage that was taken out on this home.
Original Mortgage
$300,000
Interest Rate
5.95%
Mortgage Type
Purchase Money Mortgage
Purchase Details
Closed on
Sep 28, 2001
Sold by
Phillips Robert Dean and Child Tracy
Bought by
Phillips Robert D and Child Tracy
Purchase Details
Closed on
Jul 13, 2001
Sold by
Phillips Robert Dean and Child Tracy
Bought by
Phillips Robert Dean and Child Tracy
Home Financials for this Owner
Home Financials are based on the most recent Mortgage that was taken out on this home.
Original Mortgage
$275,000
Interest Rate
7.09%
Mortgage Type
Purchase Money Mortgage
Create a Home Valuation Report for This Property
The Home Valuation Report is an in-depth analysis detailing your home's value as well as a comparison with similar homes in the area
Home Values in the Area
Average Home Value in this Area
Purchase History
| Date | Buyer | Sale Price | Title Company |
|---|---|---|---|
| Phillips Robert D | -- | Chicago Title Company | |
| Phillips Robert D | -- | Chicago Title Company | |
| Phillips Robert D | -- | Accommodation | |
| Phillips Robert D | -- | Chicago Title Company | |
| The Robert Phillips & Tracy Child Living | -- | Accommodation | |
| Phillips Robert D | -- | Chicago Title Company | |
| Phillips Robert D | -- | -- | |
| Phillips Robert D | -- | Old Republic Title Company | |
| Phillips Robert D | -- | Placer Title Company | |
| Phillips Robert D | -- | Placer Title Company | |
| Phillips Robert D | -- | -- | |
| Phillips Robert Dean | -- | First American Title Guarant |
Source: Public Records
Mortgage History
| Date | Status | Borrower | Loan Amount |
|---|---|---|---|
| Closed | Phillips Robert D | $545,000 | |
| Closed | Phillips Robert D | $417,000 | |
| Closed | Phillips Robert D | $417,000 | |
| Closed | Phillips Robert D | $300,000 | |
| Closed | Phillips Robert D | $300,000 | |
| Closed | Phillips Robert Dean | $275,000 | |
| Closed | Phillips Robert Dean | $60,000 | |
| Closed | Phillips Robert D | $80,000 |
Source: Public Records
Tax History
| Year | Tax Paid | Tax Assessment Tax Assessment Total Assessment is a certain percentage of the fair market value that is determined by local assessors to be the total taxable value of land and additions on the property. | Land | Improvement |
|---|---|---|---|---|
| 2025 | $5,959 | $257,332 | $78,940 | $185,392 |
| 2024 | $5,959 | $252,149 | $77,392 | $181,757 |
| 2023 | $5,813 | $254,069 | $75,875 | $178,194 |
| 2022 | $5,659 | $242,089 | $74,388 | $174,701 |
| 2021 | $5,639 | $237,204 | $72,929 | $171,275 |
| 2020 | $5,219 | $241,702 | $72,182 | $169,520 |
| 2019 | $4,885 | $236,962 | $70,766 | $166,196 |
| 2018 | $4,774 | $232,317 | $69,379 | $162,938 |
| 2017 | $4,588 | $227,763 | $68,019 | $159,744 |
| 2016 | $4,351 | $223,298 | $66,686 | $156,612 |
| 2015 | $4,279 | $219,945 | $65,684 | $154,261 |
| 2014 | $4,215 | $215,638 | $64,398 | $151,240 |
Source: Public Records
Map
Nearby Homes
- 2533 Grant St
- 2218 -2222 Grant St
- 1901 Parker St Unit 3
- 1634 Blake St
- 1726 Parker St Unit 2
- 1726 Parker St Unit 1
- 1604 Dwight Way
- 1819 Carleton St
- 1612 Parker St
- 2118 California St
- 1524 Blake St
- 2350 Sacramento St
- 2701 Grant St
- 1516 Blake St
- 1516 Blake St Unit A
- 2304 Edwards St
- 1431 Dwight Way
- 2437 Acton St
- 1515 Derby St
- 1512 Hearst Ave Unit 1512
- 2333 Grant St Unit 3
- 2333 Grant St Unit 1
- 2337 Grant St
- 2329 Grant St
- 2341 Grant St
- 2325 Grant St
- 1805 Channing Way
- 2334 Mckinley Ave
- 2330 Mckinley Ave
- 2326 Mckinley Ave
- 2323 Grant St
- 2347 Grant St
- 1825 Channing Way
- 2338 Mckinley Ave
- 2340 Mckinley Ave
- 2328 Mckinley Ave
- 2334 Grant St
- 2346 Mckinley Ave
- 2332 Mckinley Ave
- 1737 Channing Way
Your Personal Tour Guide
Ask me questions while you tour the home.