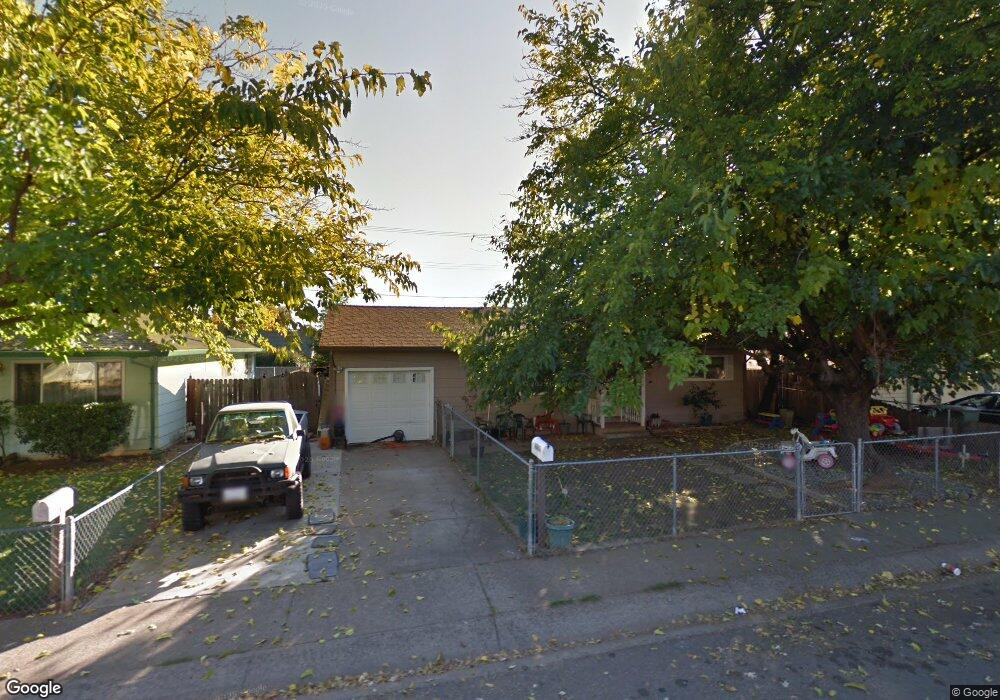
2333 Nebula St Redding, CA 96002
Starview NeighborhoodEstimated Value: $234,431 - $272,000
3
Beds
1
Bath
930
Sq Ft
$266/Sq Ft
Est. Value
About This Home
This home is located at 2333 Nebula St, Redding, CA 96002 and is currently estimated at $247,608, approximately $266 per square foot. 2333 Nebula St is a home located in Shasta County with nearby schools including Alta Mesa Elementary School, Parsons Junior High School, and Enterprise High School.
Ownership History
Date
Name
Owned For
Owner Type
Purchase Details
Closed on
Feb 2, 2012
Sold by
Bringazi Nannette
Bought by
Bringazi Nannette E
Current Estimated Value
Purchase Details
Closed on
Jun 28, 2005
Sold by
Warner Cheri L
Bought by
Warner Cheri L and Bringazi Nannette E
Purchase Details
Closed on
Jun 14, 2005
Sold by
Frommer Robert D and Frommer Christina M
Bought by
Warner Cheri L
Purchase Details
Closed on
Mar 10, 2004
Sold by
Parish Ruth B
Bought by
Frommer Robert D and Frommer Christina M
Home Financials for this Owner
Home Financials are based on the most recent Mortgage that was taken out on this home.
Original Mortgage
$92,000
Interest Rate
5.69%
Mortgage Type
Unknown
Purchase Details
Closed on
Oct 7, 1998
Sold by
Parish Leland Walter
Bought by
Parish Ruth B
Home Financials for this Owner
Home Financials are based on the most recent Mortgage that was taken out on this home.
Original Mortgage
$55,710
Interest Rate
6.88%
Create a Home Valuation Report for This Property
The Home Valuation Report is an in-depth analysis detailing your home's value as well as a comparison with similar homes in the area
Home Values in the Area
Average Home Value in this Area
Purchase History
| Date | Buyer | Sale Price | Title Company |
|---|---|---|---|
| Bringazi Nannette E | -- | None Available | |
| Warner Cheri L | -- | -- | |
| Warner Cheri L | $206,000 | Fidelity Natl Title Co Of Ca | |
| Frommer Robert D | $132,000 | First American Title Co | |
| Parish Ruth B | -- | Placer Title Company | |
| Parish Ruth B | $62,000 | Placer Title Company |
Source: Public Records
Mortgage History
| Date | Status | Borrower | Loan Amount |
|---|---|---|---|
| Previous Owner | Frommer Robert D | $92,000 | |
| Previous Owner | Parish Ruth B | $55,710 |
Source: Public Records
Tax History
| Year | Tax Paid | Tax Assessment Tax Assessment Total Assessment is a certain percentage of the fair market value that is determined by local assessors to be the total taxable value of land and additions on the property. | Land | Improvement |
|---|---|---|---|---|
| 2025 | $1,253 | $113,031 | $31,394 | $81,637 |
| 2024 | $1,235 | $110,816 | $30,779 | $80,037 |
| 2023 | $1,235 | $108,644 | $30,176 | $78,468 |
| 2022 | $1,201 | $106,515 | $29,585 | $76,930 |
| 2021 | $1,160 | $104,427 | $29,005 | $75,422 |
| 2020 | $1,154 | $103,357 | $28,708 | $74,649 |
| 2019 | $1,145 | $101,332 | $28,146 | $73,186 |
| 2018 | $1,132 | $99,346 | $27,595 | $71,751 |
| 2017 | $1,151 | $97,399 | $27,054 | $70,345 |
| 2016 | $1,077 | $95,490 | $26,524 | $68,966 |
| 2015 | $1,069 | $94,057 | $26,126 | $67,931 |
| 2014 | $1,061 | $92,216 | $25,615 | $66,601 |
Source: Public Records
Map
Nearby Homes
- 4001 Alta Mesa Dr
- 3778 Scorpius Way
- 2185 Galaxy Way
- 2332 Venus Way
- 3688 Polaris Way
- 3985 Cirrus St
- 3732 Mercury Dr
- 2704 Western Oak Dr
- 2068 Solar Way
- 3512 Capricorn Way
- 1922 Eddy Way
- 3594 Laramie St
- 1827 Bembow Dr
- 2366 Templeton Dr
- 2875 Eastbrook Dr
- 4302 Yellowstone Dr
- 1959 Alexis Ct
- 2364 La Madre Ct
- 4646 Alta Camino Dr
- 3466 Silverwood St
- 2329 Nebula St
- 2345 Nebula St
- 2351 Nebula St
- 2315 Nebula St
- 2314 Castlewood Dr
- 2344 Nebula St
- 2332 Castlewood Dr
- 2332 Nebula St
- 2350 Nebula St
- 2326 Nebula St
- 2301 Nebula St
- 2365 Nebula St
- 2298 Castlewood Dr
- 2350 Castlewood Dr
- 2360 Nebula St
- 2314 Nebula St
- 2286 Castlewood Dr
- 2277 Nebula St
- 2379 Nebula St
- 2366 Castlewood Dr
Your Personal Tour Guide
Ask me questions while you tour the home.