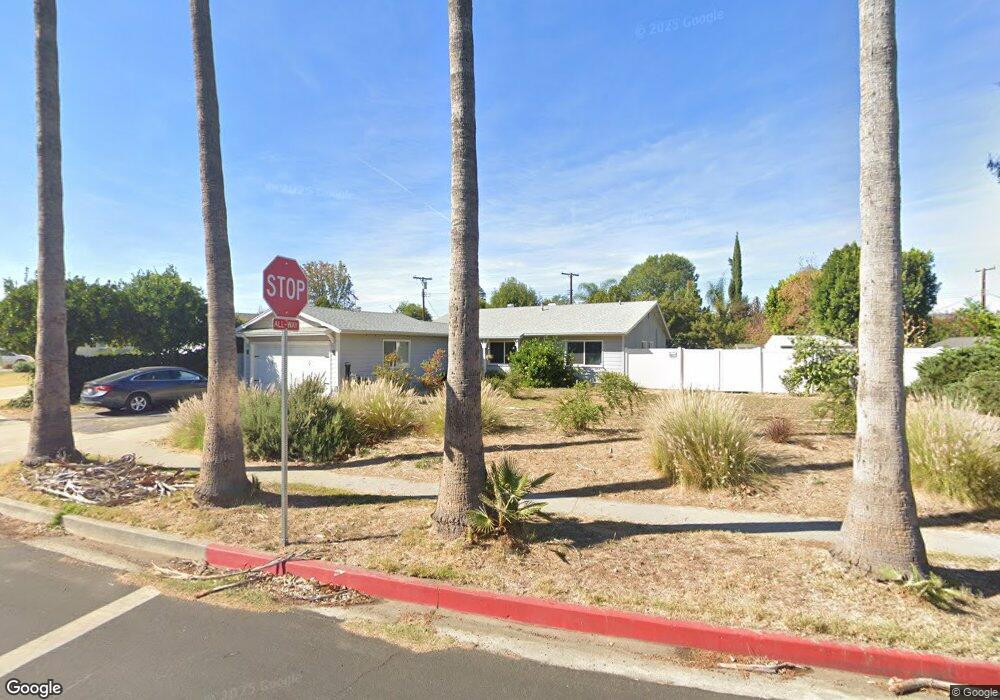
23333 Erwin St Woodland Hills, CA 91367
Estimated Value: $1,007,000 - $1,262,000
4
Beds
2
Baths
1,397
Sq Ft
$789/Sq Ft
Est. Value
About This Home
This home is located at 23333 Erwin St, Woodland Hills, CA 91367 and is currently estimated at $1,101,826, approximately $788 per square foot. 23333 Erwin St is a home located in Los Angeles County with nearby schools including Woodlake Elementary Community Charter, Lockhurst Drive Charter Elementary, and Hamlin Charter Academy.
Ownership History
Date
Name
Owned For
Owner Type
Purchase Details
Closed on
Dec 4, 2006
Sold by
Girard Arlyne and Colleen Mcnutt Trust
Bought by
Mcnutt Gary
Current Estimated Value
Home Financials for this Owner
Home Financials are based on the most recent Mortgage that was taken out on this home.
Original Mortgage
$495,000
Interest Rate
6.17%
Mortgage Type
Purchase Money Mortgage
Purchase Details
Closed on
Sep 8, 2005
Sold by
Mcnutt Colleen
Bought by
Mcnutt Colleen Ann and The Colleen Mcnutt Trust
Home Financials for this Owner
Home Financials are based on the most recent Mortgage that was taken out on this home.
Original Mortgage
$469,342
Interest Rate
5.27%
Mortgage Type
FHA
Purchase Details
Closed on
Aug 18, 1995
Sold by
Mcnutt Colleen Ann
Bought by
Mcnutt Colleen Ann and The Colleen Mcnutt Trust
Create a Home Valuation Report for This Property
The Home Valuation Report is an in-depth analysis detailing your home's value as well as a comparison with similar homes in the area
Home Values in the Area
Average Home Value in this Area
Purchase History
| Date | Buyer | Sale Price | Title Company |
|---|---|---|---|
| Mcnutt Gary | -- | Ticor Title | |
| Mcnutt Colleen Ann | -- | Cuesta Title Company | |
| Mcnutt Colleen | -- | Cuesta Title Company | |
| Mcnutt Colleen Ann | -- | -- |
Source: Public Records
Mortgage History
| Date | Status | Borrower | Loan Amount |
|---|---|---|---|
| Previous Owner | Mcnutt Gary | $495,000 | |
| Previous Owner | Mcnutt Colleen | $469,342 |
Source: Public Records
Tax History Compared to Growth
Tax History
| Year | Tax Paid | Tax Assessment Tax Assessment Total Assessment is a certain percentage of the fair market value that is determined by local assessors to be the total taxable value of land and additions on the property. | Land | Improvement |
|---|---|---|---|---|
| 2025 | $3,903 | $305,572 | $181,078 | $124,494 |
| 2024 | $3,903 | $299,581 | $177,528 | $122,053 |
| 2023 | $3,832 | $293,708 | $174,048 | $119,660 |
| 2022 | $3,662 | $287,950 | $170,636 | $117,314 |
| 2021 | $3,612 | $282,305 | $167,291 | $115,014 |
| 2020 | $3,642 | $279,411 | $165,576 | $113,835 |
| 2019 | $3,508 | $273,933 | $162,330 | $111,603 |
| 2018 | $3,402 | $268,563 | $159,148 | $109,415 |
| 2016 | $3,242 | $258,136 | $152,969 | $105,167 |
| 2015 | $3,196 | $254,260 | $150,672 | $103,588 |
| 2014 | $3,214 | $249,280 | $147,721 | $101,559 |
Source: Public Records
Map
Nearby Homes
- 6227 Glide Ave
- 23367 Friar St
- 6172 Dalecrest Ave
- 23238 Victory Blvd
- 23432 Victory Blvd
- 23201 Oxnard St
- 23123 Oxnard St
- 6001 Manton Ave
- 23416 Califa St
- 23549 Victory Blvd Unit 21
- 23116 Califa St
- 23357 Hatteras St
- 23026 Mobile St
- 6236 Kenwater Ave
- 22924 Erwin St
- 23236 Hatteras St
- 6629 Bobbyboyar Ave
- 23812 Calvert St
- 22851 Calvert St
- 22835 Styles St
- 23339 Erwin St
- 6209 Berquist Ave
- 23345 Erwin St
- 6276 Jackie Ave
- 6270 Jackie Ave
- 6223 Berquist Ave
- 6280 Jackie Ave
- 23351 Erwin St
- 6264 Jackie Ave
- 23332 Erwin St
- 6202 Berquist Ave
- 6212 Berquist Ave
- 6288 Jackie Ave
- 23346 Erwin St
- 23357 Erwin St
- 6258 Jackie Ave
- 6233 Berquist Ave
- 23352 Erwin St
- 6300 Jackie Ave
- 6222 Berquist Ave