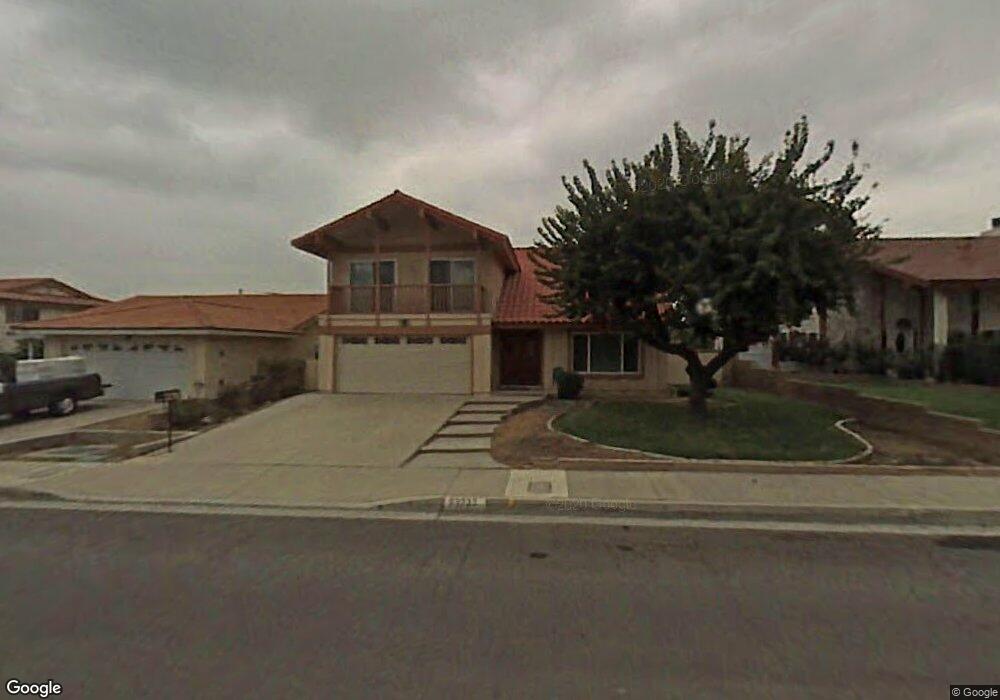
23333 Stirrup Dr Diamond Bar, CA 91765
Estimated Value: $1,045,044 - $1,134,000
4
Beds
3
Baths
2,334
Sq Ft
$470/Sq Ft
Est. Value
About This Home
This home is located at 23333 Stirrup Dr, Diamond Bar, CA 91765 and is currently estimated at $1,096,011, approximately $469 per square foot. 23333 Stirrup Dr is a home located in Los Angeles County with nearby schools including Armstrong Elementary School, Lorbeer Middle School, and Diamond Ranch High School.
Ownership History
Date
Name
Owned For
Owner Type
Purchase Details
Closed on
Feb 26, 2003
Sold by
Garg Sumit
Bought by
Way Samuel D
Current Estimated Value
Home Financials for this Owner
Home Financials are based on the most recent Mortgage that was taken out on this home.
Original Mortgage
$309,600
Interest Rate
5.78%
Purchase Details
Closed on
Aug 21, 2002
Sold by
Njoo Ie Wei
Bought by
Garg Sumit
Home Financials for this Owner
Home Financials are based on the most recent Mortgage that was taken out on this home.
Original Mortgage
$300,700
Interest Rate
5%
Purchase Details
Closed on
Sep 28, 1993
Sold by
Wong Wai
Bought by
Njoo Ie Wei
Create a Home Valuation Report for This Property
The Home Valuation Report is an in-depth analysis detailing your home's value as well as a comparison with similar homes in the area
Home Values in the Area
Average Home Value in this Area
Purchase History
| Date | Buyer | Sale Price | Title Company |
|---|---|---|---|
| Way Samuel D | $387,000 | Chicago Title Co | |
| Garg Sumit | $338,000 | Chicago Title | |
| Njoo Ie Wei | -- | -- |
Source: Public Records
Mortgage History
| Date | Status | Borrower | Loan Amount |
|---|---|---|---|
| Closed | Way Samuel D | $309,600 | |
| Previous Owner | Garg Sumit | $300,700 | |
| Closed | Way Samuel D | $58,000 |
Source: Public Records
Tax History
| Year | Tax Paid | Tax Assessment Tax Assessment Total Assessment is a certain percentage of the fair market value that is determined by local assessors to be the total taxable value of land and additions on the property. | Land | Improvement |
|---|---|---|---|---|
| 2025 | $7,320 | $560,485 | $346,574 | $213,911 |
| 2024 | $7,320 | $549,496 | $339,779 | $209,717 |
| 2023 | $7,131 | $538,722 | $333,117 | $205,605 |
| 2022 | $6,972 | $528,160 | $326,586 | $201,574 |
| 2021 | $6,813 | $517,805 | $320,183 | $197,622 |
| 2019 | $6,960 | $502,448 | $310,687 | $191,761 |
| 2018 | $6,449 | $492,597 | $304,596 | $188,001 |
| 2016 | $6,047 | $473,470 | $292,769 | $180,701 |
| 2015 | $5,997 | $466,359 | $288,372 | $177,987 |
| 2014 | $5,954 | $457,225 | $282,724 | $174,501 |
Source: Public Records
Map
Nearby Homes
- 23426 Clayhorn Dr
- 579 Golden Prados Dr
- 22824 Hilton Head Dr Unit 90
- 300 S Prospectors Rd Unit 29
- 22812 Hilton Head Dr Unit 48
- 22812 Hilton Head Dr Unit 44
- 22808 Hilton Head Dr Unit 30
- 22804 Hilton Head Dr Unit 39
- 374 S Prospectors Rd Unit 126
- 22892 Hilton Head Dr Unit 285
- 22709 Lakeway Dr Unit 493
- 312 Torito Ln
- 22725 Lakeway Dr Unit 396
- 23875 Canyon Vista Ct
- 23601 Golden Springs Dr
- 23641 Golden Springs Dr Unit C-4
- 23517 Twin Spring Ln
- 1110 Cleghorn Dr Unit D
- 23640 Monument Canyon Dr Unit C
- 158 Cottonwood Cove Dr
- 23345 Stirrup Dr
- 23329 Stirrup Dr
- 23351 Stirrup Dr
- 23325 Stirrup Dr
- 630 Great Bend Dr
- 624 Great Bend Dr
- 636 Great Bend Dr
- 618 Great Bend Dr
- 23317 Stirrup Dr
- 23357 Stirrup Dr
- 703 Panhandle Dr
- 23342 Stirrup Dr
- 23336 Stirrup Dr
- 644 Great Bend Dr
- 612 Great Bend Dr
- 23330 Stirrup Dr
- 23311 Stirrup Dr
- 23403 Stirrup Dr
- 713 Panhandle Dr
- 606 Great Bend Dr
Your Personal Tour Guide
Ask me questions while you tour the home.