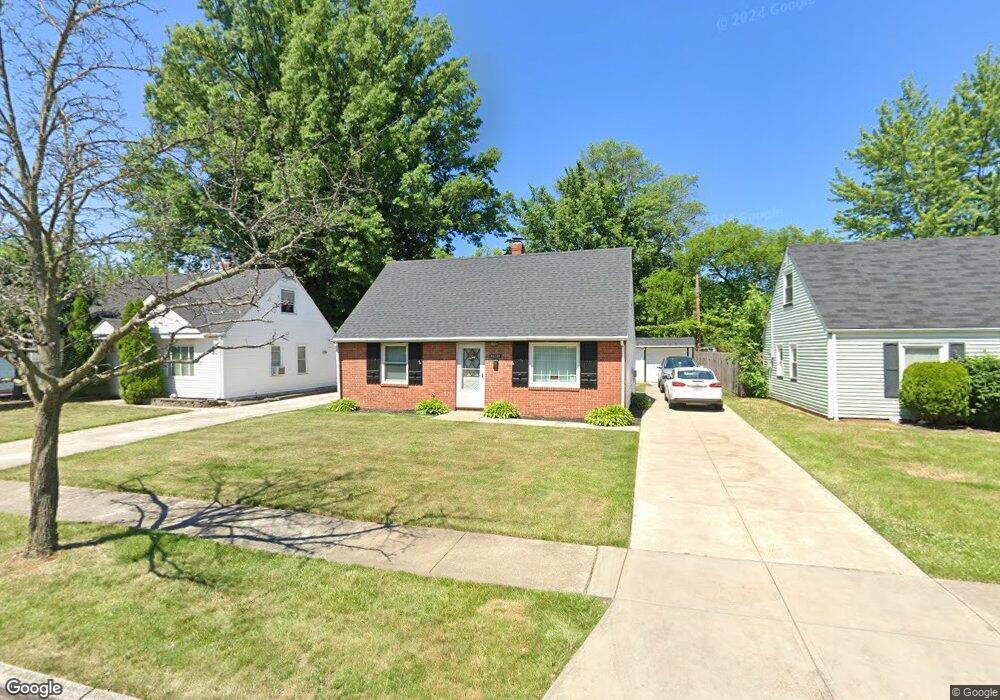
23339 Roger Dr Euclid, OH 44123
Estimated Value: $117,000 - $144,000
4
Beds
1
Bath
1,548
Sq Ft
$83/Sq Ft
Est. Value
About This Home
This home is located at 23339 Roger Dr, Euclid, OH 44123 and is currently estimated at $128,854, approximately $83 per square foot. 23339 Roger Dr is a home located in Cuyahoga County with nearby schools including Bluestone Elementary School, Euclid High School, and Our Lady Of The Lake School.
Ownership History
Date
Name
Owned For
Owner Type
Purchase Details
Closed on
Feb 11, 2017
Sold by
Jones Marsha M and Tidmore Marsha E
Bought by
Mcghee Derrrick A
Current Estimated Value
Home Financials for this Owner
Home Financials are based on the most recent Mortgage that was taken out on this home.
Original Mortgage
$57,931
Interest Rate
4.89%
Mortgage Type
FHA
Purchase Details
Closed on
Jun 21, 2002
Sold by
Kunka Peter M and Kunka Mary A
Bought by
Jones Marsha E
Home Financials for this Owner
Home Financials are based on the most recent Mortgage that was taken out on this home.
Original Mortgage
$100,878
Interest Rate
6.93%
Mortgage Type
VA
Purchase Details
Closed on
Jun 15, 1992
Sold by
Bitker Jeffrey A
Bought by
Kunka Peter M
Purchase Details
Closed on
Mar 11, 1981
Bought by
Bitker Jeffrey A
Purchase Details
Closed on
Jan 1, 1975
Bought by
Jacqueline
Create a Home Valuation Report for This Property
The Home Valuation Report is an in-depth analysis detailing your home's value as well as a comparison with similar homes in the area
Home Values in the Area
Average Home Value in this Area
Purchase History
| Date | Buyer | Sale Price | Title Company |
|---|---|---|---|
| Mcghee Derrrick A | $59,000 | Ohio Real Title | |
| Jones Marsha E | $98,900 | -- | |
| Kunka Peter M | $59,000 | -- | |
| Bitker Jeffrey A | -- | -- | |
| Jacqueline | -- | -- |
Source: Public Records
Mortgage History
| Date | Status | Borrower | Loan Amount |
|---|---|---|---|
| Previous Owner | Mcghee Derrrick A | $57,931 | |
| Previous Owner | Jones Marsha E | $100,878 |
Source: Public Records
Tax History
| Year | Tax Paid | Tax Assessment Tax Assessment Total Assessment is a certain percentage of the fair market value that is determined by local assessors to be the total taxable value of land and additions on the property. | Land | Improvement |
|---|---|---|---|---|
| 2024 | $2,764 | $40,005 | $8,260 | $31,745 |
| 2023 | $1,973 | $22,300 | $6,020 | $16,280 |
| 2022 | $1,930 | $22,300 | $6,020 | $16,280 |
| 2021 | $2,147 | $22,300 | $6,020 | $16,280 |
| 2020 | $2,178 | $20,650 | $5,570 | $15,090 |
| 2019 | $1,955 | $59,000 | $15,900 | $43,100 |
| 2018 | $1,989 | $20,650 | $5,570 | $15,090 |
| 2017 | $3,190 | $28,460 | $5,460 | $23,000 |
| 2016 | $3,197 | $28,460 | $5,460 | $23,000 |
| 2015 | $4,601 | $28,460 | $5,460 | $23,000 |
| 2014 | $4,601 | $28,460 | $5,460 | $23,000 |
Source: Public Records
Map
Nearby Homes
- 324 E 235th St
- 334 E 238th St
- 323 E 235th St
- 328 E 238th St
- 23298 Williams Ave
- 303 E 235th St
- 23198 Gay St
- 244 E 238th St
- 325 E 244th St
- 24181 Devoe Ave
- 71 Lake Edge Dr
- 368 E 248th St
- 110 E 238th St
- 55 Sunnycliff Dr
- 24891 Zeman Ave
- 464 E 250th St
- 461 Kenwood Dr Unit T3
- 515 E 250th St
- 521 Kenwood Dr Unit B-5
- 470 Kenwood Dr Unit D
- 23337 Roger Dr
- 23335 Roger Dr
- 23305 Roger Dr
- 23301 Roger Dr
- 23307 Roger Dr
- 23331 Roger Dr
- 23338 Roger Dr
- 23340 Roger Dr
- 23336 Roger Dr
- 23311 Roger Dr
- 23342 Roger Dr
- 23334 Roger Dr
- 23325 Roger Dr
- 23445 Farringdon Ave Unit 66
- 23332 Roger Dr
- 23313 Roger Dr
- 23321 Roger Dr
- 23317 Roger Dr
- 23427 Farringdon Ave Unit 63
- 23423 Farringdon Ave Unit 62
Your Personal Tour Guide
Ask me questions while you tour the home.