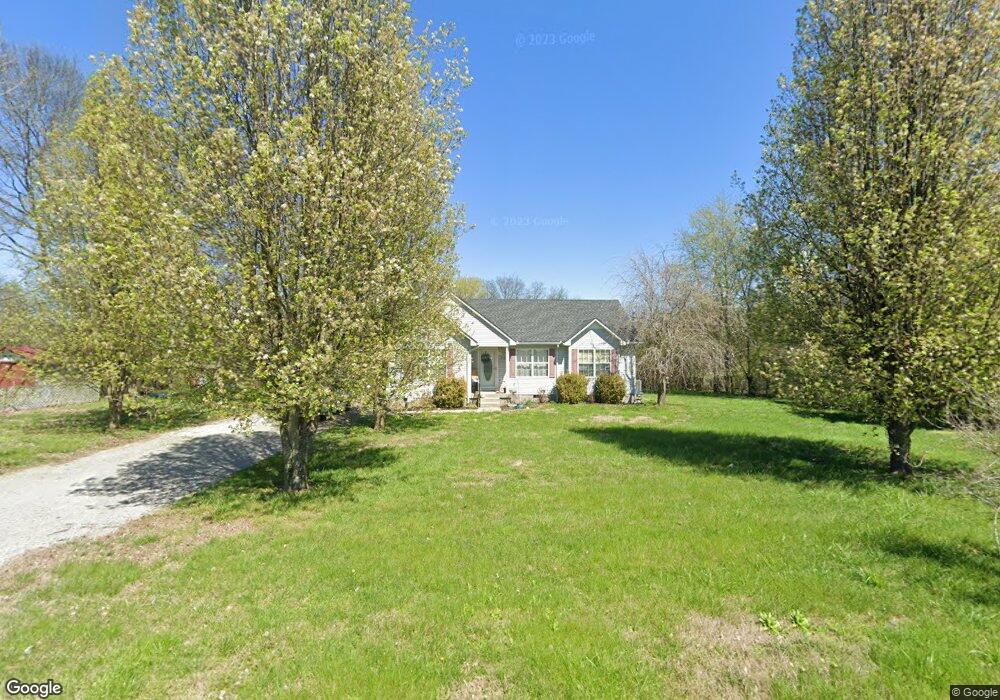
2334 Anes Station Rd Lewisburg, TN 37091
Estimated Value: $262,000 - $311,000
--
Bed
2
Baths
1,246
Sq Ft
$229/Sq Ft
Est. Value
About This Home
This home is located at 2334 Anes Station Rd, Lewisburg, TN 37091 and is currently estimated at $284,966, approximately $228 per square foot. 2334 Anes Station Rd is a home located in Marshall County with nearby schools including Oak Grove Elementary School, Marshall Elementary School, and Westhills Elementary School.
Ownership History
Date
Name
Owned For
Owner Type
Purchase Details
Closed on
Apr 3, 2013
Sold by
Morgan Daniel
Bought by
Hickman Brian and Hickman Kayla
Current Estimated Value
Home Financials for this Owner
Home Financials are based on the most recent Mortgage that was taken out on this home.
Original Mortgage
$86,632
Outstanding Balance
$61,371
Interest Rate
3.55%
Mortgage Type
Commercial
Estimated Equity
$223,595
Purchase Details
Closed on
Nov 18, 2005
Sold by
Jason Jent
Bought by
Daniel Morgan and Daniel Jamie
Home Financials for this Owner
Home Financials are based on the most recent Mortgage that was taken out on this home.
Original Mortgage
$88,000
Interest Rate
6.04%
Mortgage Type
Cash
Purchase Details
Closed on
Jul 14, 2005
Sold by
Ross Tate
Bought by
Jason Jent
Purchase Details
Closed on
Oct 29, 2004
Sold by
Henson Dena L
Bought by
Ross Tate and Ross Sandy
Purchase Details
Closed on
Feb 12, 2004
Bought by
Henson Dena L
Create a Home Valuation Report for This Property
The Home Valuation Report is an in-depth analysis detailing your home's value as well as a comparison with similar homes in the area
Home Values in the Area
Average Home Value in this Area
Purchase History
| Date | Buyer | Sale Price | Title Company |
|---|---|---|---|
| Hickman Brian | $89,900 | -- | |
| Daniel Morgan | $94,000 | -- | |
| Jason Jent | $16,000 | -- | |
| Ross Tate | $12,100 | -- | |
| Henson Dena L | $100,000 | -- |
Source: Public Records
Mortgage History
| Date | Status | Borrower | Loan Amount |
|---|---|---|---|
| Open | Hickman Brian | $86,632 | |
| Previous Owner | Henson Dena L | $88,000 |
Source: Public Records
Tax History Compared to Growth
Tax History
| Year | Tax Paid | Tax Assessment Tax Assessment Total Assessment is a certain percentage of the fair market value that is determined by local assessors to be the total taxable value of land and additions on the property. | Land | Improvement |
|---|---|---|---|---|
| 2024 | $841 | $46,250 | $8,650 | $37,600 |
| 2023 | $841 | $46,250 | $8,650 | $37,600 |
| 2022 | $841 | $46,250 | $8,650 | $37,600 |
| 2021 | $718 | $25,525 | $3,125 | $22,400 |
| 2020 | $718 | $25,525 | $3,125 | $22,400 |
| 2019 | $718 | $25,525 | $3,125 | $22,400 |
| 2018 | $666 | $25,525 | $3,125 | $22,400 |
| 2017 | $666 | $24,100 | $3,125 | $20,975 |
| 2016 | $696 | $21,600 | $3,000 | $18,600 |
| 2015 | $696 | $21,600 | $3,000 | $18,600 |
| 2014 | $696 | $21,600 | $3,000 | $18,600 |
Source: Public Records
Map
Nearby Homes
- 2421 Anes Station Rd
- 2512 Verona Caney Rd
- 2159 Verona Caney Rd
- 2661 Anes Station Rd
- 2989 Stegall Rd
- 1510 Wade Brown Rd
- 2829 Anes Station Rd
- 0 Wallace Thompson Rd
- 1820 Wade Brown Rd
- 2996 Verona Caney Rd
- 0 Anes Station Rd
- 3388 Anes Station Rd
- 1830 Bethbirei Rd
- 1800 Mcbride Rd
- 1755 Mcbride Rd
- 2137 Horton Way
- 1180 Snell Rd
- 1520 Powell Ln
- 0 Powell Ln
- 3130 Nashville Hwy
- 2336 Anes Station Rd
- 2332 Anes Station Rd
- 2333 Anes Station Rd
- 2327 Anes Station Rd
- 2323 Anes Station Rd
- 2304 Anes Station Rd
- 2346 Anes Station Rd
- 2400 Anes Station Rd
- 2347 Anes Station Rd
- 2303 Anes Station Rd
- 2343 Anes Station Rd
- 2418 Anes Station Rd
- 1331 Wade Brown Rd
- 2428 Anes Station Rd
- 2440 Anes Station Rd
- 2461 Verona Caney Rd
- 1350 Wade Brown Rd
- 2481 Anes Station Rd
- 2431 Anes Station Rd
- 2451 Verona Caney Rd