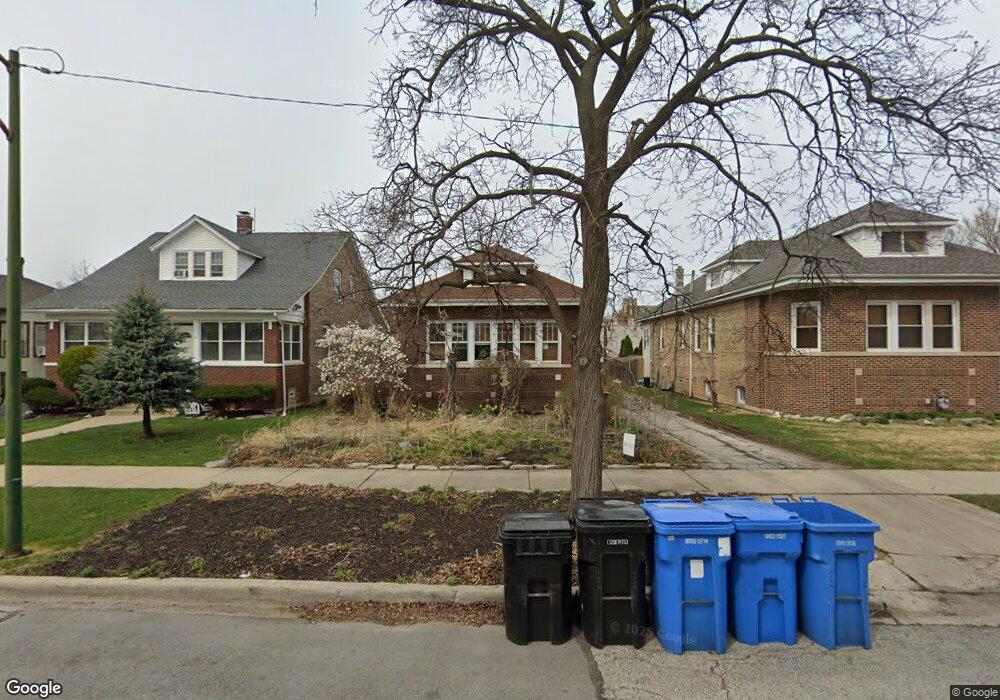
2334 W 111th Place Chicago, IL 60643
Morgan Park NeighborhoodEstimated Value: $263,000 - $321,000
3
Beds
1
Bath
1,290
Sq Ft
$234/Sq Ft
Est. Value
About This Home
This home is located at 2334 W 111th Place, Chicago, IL 60643 and is currently estimated at $301,441, approximately $233 per square foot. 2334 W 111th Place is a home located in Cook County with nearby schools including Clissold Elementary School, Morgan Park High School, and Morgan Park Academy.
Ownership History
Date
Name
Owned For
Owner Type
Purchase Details
Closed on
Feb 20, 2008
Sold by
Horner Michael
Bought by
Horner Susannah Papish
Current Estimated Value
Purchase Details
Closed on
Dec 20, 2001
Sold by
State Bank Of Countryside
Bought by
Capital Acquisitions & Development Inc
Home Financials for this Owner
Home Financials are based on the most recent Mortgage that was taken out on this home.
Original Mortgage
$940,000
Interest Rate
6.5%
Purchase Details
Closed on
Dec 20, 2000
Sold by
Scott John P
Bought by
Horner Michael J and Papish Horner Susannah
Home Financials for this Owner
Home Financials are based on the most recent Mortgage that was taken out on this home.
Original Mortgage
$139,900
Interest Rate
7.77%
Mortgage Type
FHA
Purchase Details
Closed on
Apr 1, 1993
Sold by
Gassmann Susan C and Giles Susan C
Bought by
Scott John P
Create a Home Valuation Report for This Property
The Home Valuation Report is an in-depth analysis detailing your home's value as well as a comparison with similar homes in the area
Home Values in the Area
Average Home Value in this Area
Purchase History
| Date | Buyer | Sale Price | Title Company |
|---|---|---|---|
| Horner Susannah Papish | -- | Ctic | |
| Capital Acquisitions & Development Inc | -- | -- | |
| Horner Michael J | $142,000 | First American Title | |
| Scott John P | -- | -- |
Source: Public Records
Mortgage History
| Date | Status | Borrower | Loan Amount |
|---|---|---|---|
| Previous Owner | Capital Acquisitions & Development Inc | $940,000 | |
| Previous Owner | Horner Michael J | $139,900 |
Source: Public Records
Tax History Compared to Growth
Tax History
| Year | Tax Paid | Tax Assessment Tax Assessment Total Assessment is a certain percentage of the fair market value that is determined by local assessors to be the total taxable value of land and additions on the property. | Land | Improvement |
|---|---|---|---|---|
| 2024 | $3,740 | $28,000 | $7,920 | $20,080 |
| 2023 | $3,627 | $21,000 | $6,270 | $14,730 |
| 2022 | $3,627 | $21,000 | $6,270 | $14,730 |
| 2021 | $3,563 | $21,000 | $6,270 | $14,730 |
| 2020 | $4,212 | $21,965 | $6,270 | $15,695 |
| 2019 | $4,119 | $23,875 | $6,270 | $17,605 |
| 2018 | $4,048 | $23,875 | $6,270 | $17,605 |
| 2017 | $4,161 | $22,662 | $5,610 | $17,052 |
| 2016 | $4,048 | $22,662 | $5,610 | $17,052 |
| 2015 | $3,681 | $22,662 | $5,610 | $17,052 |
| 2014 | $3,090 | $19,182 | $5,280 | $13,902 |
| 2013 | $3,018 | $19,182 | $5,280 | $13,902 |
Source: Public Records
Map
Nearby Homes
- 2348 W 111th St Unit 3
- 2336 W 111th St Unit 2
- 2302 W 112th St
- 2300 W 112th St
- 2215 W 111th St Unit 101
- 11017 S Campbell Ave
- 2519 W 110th St
- 2550 W 112th St Unit 15-O
- 2550 W 112th St Unit 12L
- 2518 W 109th Place
- 11345 S Bell Ave
- 2022 W 111th St Unit 1S
- 11200 S Longwood Dr
- 2014 W 111th St Unit 2N
- 2012 W 111th St Unit 3S
- 10829 S Maplewood Ave
- 11125 S Fairfield Ave
- 2319 W 115th St
- 11438 S Maplewood Ave
- 2005 W Edmaire St
- 2328 W 111th Place
- 2338 W 111th Place
- 2324 W 111th Place
- 2344 W 111th Place
- 2318 W 111th Place
- 2335 W 111th Place
- 2314 W 111th Place
- 2341 W 111th Place
- 2329 W 111th Place
- 2345 W 111th Place
- 2325 W 111th Place
- 11101 S Western Ave
- 2349 W 111th Place
- 2321 W 111th Place
- 2310 W 111th Place
- 2355 W 111th Place
- 2313 W 111th Place
- 2304 W 111th Place
- 2307 W 111th Place
- 2330 W 111th St