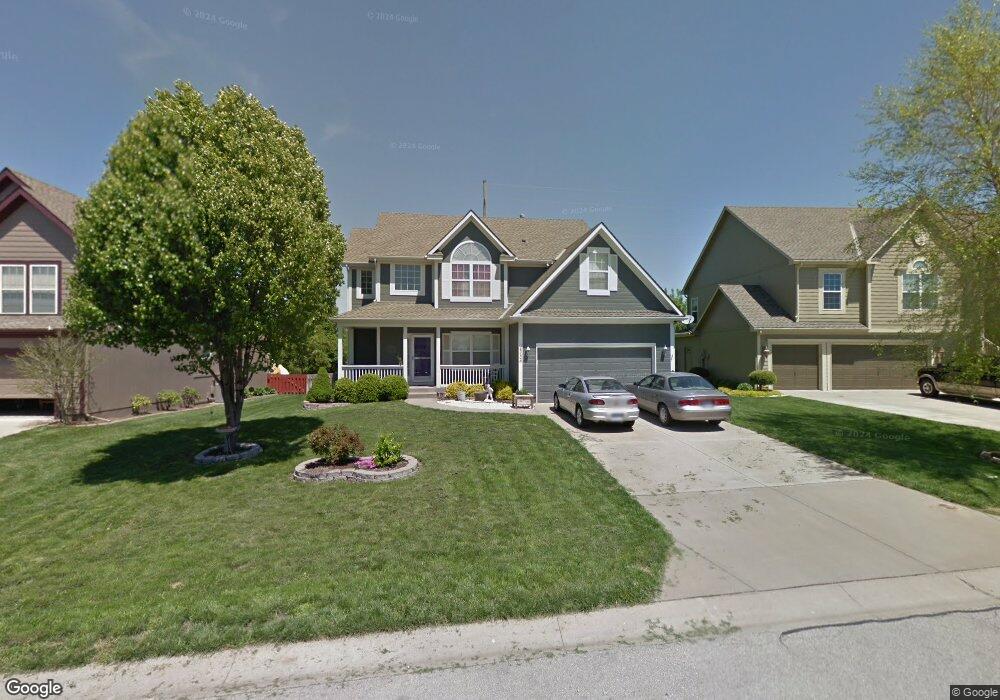
2334 W Elizabeth St Olathe, KS 66061
Estimated Value: $431,000 - $471,000
4
Beds
3
Baths
2,099
Sq Ft
$216/Sq Ft
Est. Value
About This Home
This home is located at 2334 W Elizabeth St, Olathe, KS 66061 and is currently estimated at $454,368, approximately $216 per square foot. 2334 W Elizabeth St is a home located in Johnson County with nearby schools including Prairie Center Elementary School, Mission Trail Middle School, and Olathe West High School.
Ownership History
Date
Name
Owned For
Owner Type
Purchase Details
Closed on
May 30, 2007
Sold by
Magee Matthew and Dillon Tina
Bought by
Butler Marvin Virgil and Butler Laura M
Current Estimated Value
Home Financials for this Owner
Home Financials are based on the most recent Mortgage that was taken out on this home.
Original Mortgage
$218,601
Outstanding Balance
$133,471
Interest Rate
6.15%
Mortgage Type
VA
Estimated Equity
$320,897
Purchase Details
Closed on
Apr 18, 2002
Sold by
Stubler Matthew J and Stubler Virginia L
Bought by
Magee Matthew and Magee Tina
Home Financials for this Owner
Home Financials are based on the most recent Mortgage that was taken out on this home.
Original Mortgage
$165,243
Interest Rate
7.09%
Mortgage Type
Stand Alone First
Purchase Details
Closed on
Oct 30, 2001
Sold by
Stubler Brothers Ltd
Bought by
Stubler Matthew J and Stubler David A
Create a Home Valuation Report for This Property
The Home Valuation Report is an in-depth analysis detailing your home's value as well as a comparison with similar homes in the area
Home Values in the Area
Average Home Value in this Area
Purchase History
| Date | Buyer | Sale Price | Title Company |
|---|---|---|---|
| Butler Marvin Virgil | -- | Kansas City Title | |
| Magee Matthew | -- | Realty Title Co | |
| Stubler Matthew J | -- | Midwest Title Company Inc |
Source: Public Records
Mortgage History
| Date | Status | Borrower | Loan Amount |
|---|---|---|---|
| Open | Butler Marvin Virgil | $218,601 | |
| Closed | Magee Matthew | $165,243 | |
| Closed | Magee Matthew | $37,770 |
Source: Public Records
Tax History Compared to Growth
Tax History
| Year | Tax Paid | Tax Assessment Tax Assessment Total Assessment is a certain percentage of the fair market value that is determined by local assessors to be the total taxable value of land and additions on the property. | Land | Improvement |
|---|---|---|---|---|
| 2024 | $5,106 | $45,333 | $8,747 | $36,586 |
| 2023 | $4,962 | $43,229 | $7,956 | $35,273 |
| 2022 | $4,611 | $39,088 | $7,232 | $31,856 |
| 2021 | $4,424 | $35,754 | $6,578 | $29,176 |
| 2020 | $4,234 | $33,925 | $5,979 | $27,946 |
| 2019 | $4,219 | $33,580 | $5,979 | $27,601 |
| 2018 | $4,095 | $32,361 | $5,436 | $26,925 |
| 2017 | $3,862 | $30,222 | $5,176 | $25,046 |
| 2016 | $3,601 | $28,911 | $5,176 | $23,735 |
| 2015 | $3,355 | $26,967 | $5,176 | $21,791 |
| 2013 | -- | $24,311 | $4,695 | $19,616 |
Source: Public Records
Map
Nearby Homes
- 2314 W Hazelwood St
- 23659 W 125th Terrace
- 12519 S Mesquite St
- 12576 S Meadow View St
- 12544 S Meadow View St
- 912 N Arroyo Dr
- 23444 W 125th St
- 12541 S Hedge Ct
- 12525 S Hedge Ct
- 12517 S Hedge Ct
- 23274 W 125th St
- 23166 W 125th Terrace
- 24331 W 126th Terrace
- 0 N Findley St
- 24363 W 126th Terrace
- 988 N Persimmon Dr
- 23217 W 124th Place
- 895 N Diane Dr
- 24443 W 126th Terrace
- 24559 W 126th Terrace
- 2324 W Elizabeth St
- 2354 W Elizabeth St
- 943 N Canyon Dr
- 2333 W Elizabeth St
- 2364 W Elizabeth St
- 2320 W Elizabeth St
- 2343 W Elizabeth St
- 12689 S Kenton Ct
- 939 N Canyon Dr
- 2374 W Elizabeth St
- 2353 W Elizabeth St
- 2314 W Elizabeth St
- 12681 S Kenton Ct
- 12688 S Kenton Ct
- 2363 W Elizabeth St
- 2338 W Hazelwood St
- 935 N Canyon Dr
- 2384 W Elizabeth St
- 2348 W Hazelwood St
- 23585 W 126th Terrace