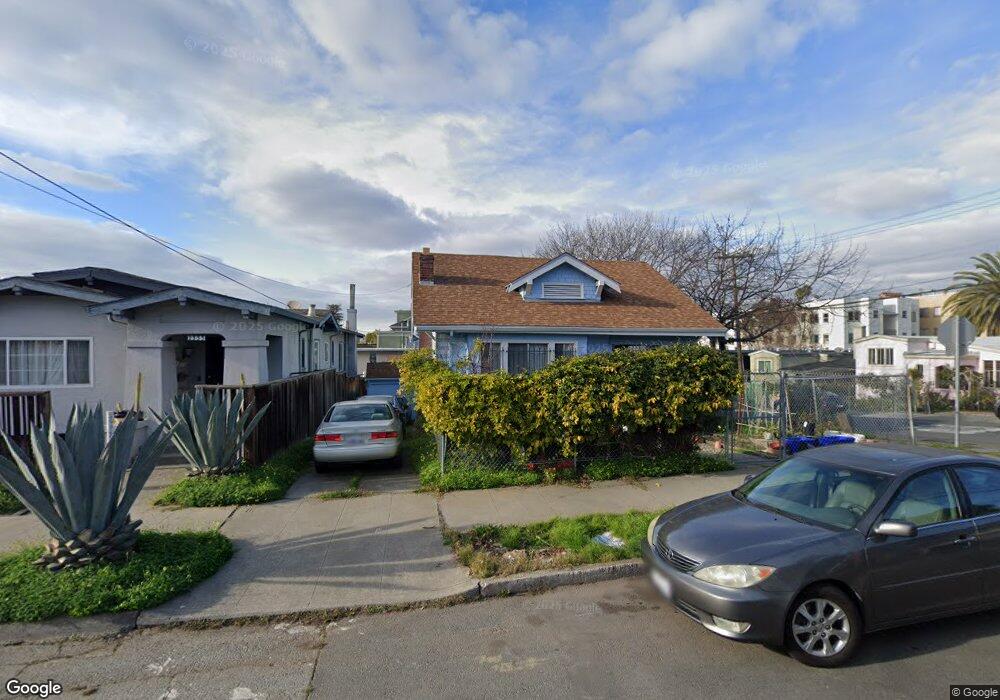
2335 9th Ave Oakland, CA 94606
Clinton NeighborhoodEstimated Value: $774,000 - $1,013,289
--
Bed
--
Bath
2,093
Sq Ft
$427/Sq Ft
Est. Value
About This Home
This home is located at 2335 9th Ave, Oakland, CA 94606 and is currently estimated at $893,645, approximately $426 per square foot. 2335 9th Ave is a home located in Alameda County with nearby schools including Bella Vista Elementary School, Edna Brewer Middle School, and Oakland High School.
Ownership History
Date
Name
Owned For
Owner Type
Purchase Details
Closed on
Aug 18, 2009
Sold by
Lee Jefferson and Lee Jefferson H
Bought by
Lee Jefferson and Lee Joanna
Current Estimated Value
Purchase Details
Closed on
Dec 7, 2004
Sold by
Lee Wilson C
Bought by
Lee Jefferson H
Purchase Details
Closed on
Nov 11, 1998
Sold by
Liu Chiu C and Liu Chun K
Bought by
Lee Wilson C and Wong Lily Lai Lin
Home Financials for this Owner
Home Financials are based on the most recent Mortgage that was taken out on this home.
Original Mortgage
$150,000
Outstanding Balance
$31,395
Interest Rate
6.12%
Mortgage Type
Commercial
Estimated Equity
$862,250
Purchase Details
Closed on
Sep 29, 1997
Sold by
Liu Chun Kui
Bought by
Liu Chiu Chun
Purchase Details
Closed on
May 22, 1996
Sold by
Tang Liu Chun Kui
Bought by
Liu Chiu Chun
Purchase Details
Closed on
Sep 23, 1994
Sold by
Papageorgopoulos George and Kakos George
Bought by
Liu Chiu Chun and Liu Chun Kui Tang
Create a Home Valuation Report for This Property
The Home Valuation Report is an in-depth analysis detailing your home's value as well as a comparison with similar homes in the area
Home Values in the Area
Average Home Value in this Area
Purchase History
| Date | Buyer | Sale Price | Title Company |
|---|---|---|---|
| Lee Jefferson | -- | None Available | |
| Lee Jefferson H | -- | -- | |
| Lee Wilson C | $200,000 | Fidelity National Title Co | |
| Liu Chiu Chun | -- | Fidelity National Title Co | |
| Liu Chiu Chun | -- | Fidelity National Title Ins | |
| Liu Chiu Chun | $75,000 | Fidelity National Title |
Source: Public Records
Mortgage History
| Date | Status | Borrower | Loan Amount |
|---|---|---|---|
| Open | Lee Wilson C | $150,000 |
Source: Public Records
Tax History Compared to Growth
Tax History
| Year | Tax Paid | Tax Assessment Tax Assessment Total Assessment is a certain percentage of the fair market value that is determined by local assessors to be the total taxable value of land and additions on the property. | Land | Improvement |
|---|---|---|---|---|
| 2025 | $6,239 | $313,523 | $94,057 | $219,466 |
| 2024 | $6,239 | $307,377 | $92,213 | $215,164 |
| 2023 | $6,431 | $301,351 | $90,405 | $210,946 |
| 2022 | $6,145 | $295,443 | $88,633 | $206,810 |
| 2021 | $5,712 | $289,651 | $86,895 | $202,756 |
| 2020 | $5,646 | $286,681 | $86,004 | $200,677 |
| 2019 | $5,331 | $281,061 | $84,318 | $196,743 |
| 2018 | $5,222 | $275,551 | $82,665 | $192,886 |
| 2017 | $4,981 | $270,150 | $81,045 | $189,105 |
| 2016 | $4,767 | $264,853 | $79,456 | $185,397 |
| 2015 | $4,739 | $260,875 | $78,262 | $182,613 |
| 2014 | $4,906 | $255,765 | $76,729 | $179,036 |
Source: Public Records
Map
Nearby Homes