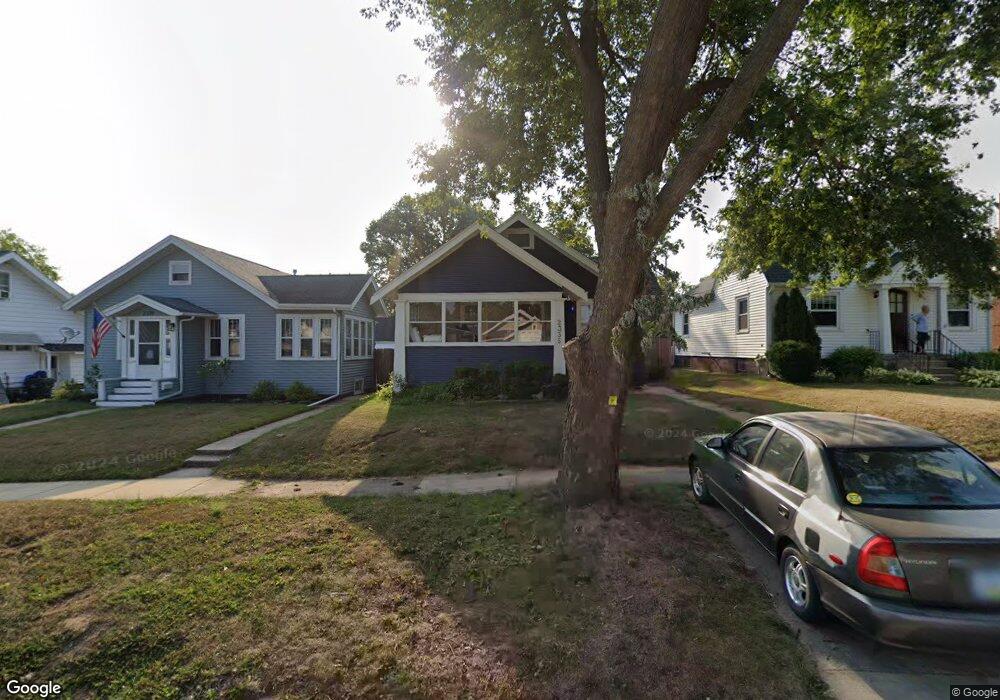
2335 C Ave NE Cedar Rapids, IA 52402
Mound View NeighborhoodEstimated Value: $116,000 - $163,000
3
Beds
2
Baths
1,226
Sq Ft
$121/Sq Ft
Est. Value
About This Home
This home is located at 2335 C Ave NE, Cedar Rapids, IA 52402 and is currently estimated at $147,900, approximately $120 per square foot. 2335 C Ave NE is a home located in Linn County with nearby schools including Arthur Elementary School, Franklin Middle School, and George Washington High School.
Ownership History
Date
Name
Owned For
Owner Type
Purchase Details
Closed on
Nov 13, 2020
Sold by
Chiafos Kristine G
Bought by
Boge Christine N and Christine N Boge Revocable Trust
Current Estimated Value
Purchase Details
Closed on
Feb 10, 2005
Sold by
Miller James J and Watkins Miller Elaine C
Bought by
Chiafos Kristine G
Home Financials for this Owner
Home Financials are based on the most recent Mortgage that was taken out on this home.
Original Mortgage
$98,718
Interest Rate
5.83%
Mortgage Type
FHA
Purchase Details
Closed on
Sep 13, 2001
Sold by
Contract Exchange Corp
Bought by
Miller James J and Watkins Miller Elaine C
Home Financials for this Owner
Home Financials are based on the most recent Mortgage that was taken out on this home.
Original Mortgage
$75,500
Interest Rate
7.03%
Purchase Details
Closed on
Apr 16, 2001
Sold by
Schladetzky Julia Ann and Schladetzky Robert
Bought by
Contract Exchange Corp
Create a Home Valuation Report for This Property
The Home Valuation Report is an in-depth analysis detailing your home's value as well as a comparison with similar homes in the area
Home Values in the Area
Average Home Value in this Area
Purchase History
| Date | Buyer | Sale Price | Title Company |
|---|---|---|---|
| Boge Christine N | $82,000 | None Available | |
| Christine N Boge Revocable Tru | $130,400 | Viner Law Firm Pc | |
| Chiafos Kristine G | $99,000 | -- | |
| Miller James J | $83,500 | -- | |
| Contract Exchange Corp | $64,500 | -- |
Source: Public Records
Mortgage History
| Date | Status | Borrower | Loan Amount |
|---|---|---|---|
| Previous Owner | Chiafos Kristine G | $98,718 | |
| Previous Owner | Miller James J | $75,500 |
Source: Public Records
Tax History Compared to Growth
Tax History
| Year | Tax Paid | Tax Assessment Tax Assessment Total Assessment is a certain percentage of the fair market value that is determined by local assessors to be the total taxable value of land and additions on the property. | Land | Improvement |
|---|---|---|---|---|
| 2025 | $2,416 | $144,800 | $29,600 | $115,200 |
| 2024 | $2,640 | $136,500 | $27,500 | $109,000 |
| 2023 | $2,640 | $136,500 | $27,500 | $109,000 |
| 2022 | $2,408 | $125,200 | $24,500 | $100,700 |
| 2021 | $2,168 | $116,200 | $24,500 | $91,700 |
| 2020 | $2,168 | $106,900 | $20,400 | $86,500 |
| 2019 | $2,042 | $106,900 | $20,400 | $86,500 |
| 2018 | $1,982 | $103,300 | $20,400 | $82,900 |
| 2017 | $1,996 | $100,200 | $20,400 | $79,800 |
| 2016 | $2,079 | $97,800 | $20,400 | $77,400 |
| 2015 | $2,205 | $103,653 | $20,400 | $83,253 |
| 2014 | $2,020 | $108,503 | $20,400 | $88,103 |
| 2013 | $2,074 | $108,503 | $20,400 | $88,103 |
Source: Public Records
Map
Nearby Homes
- 2522 A Ave NE
- 418 21st St NE
- 2602 E Ave NE
- 2222 1st Ave NE Unit 107
- 2222 1st Ave NE Unit 307
- 2222 1st Ave NE Unit 305
- 2222 1st Ave NE Unit 507
- 2222 1st Ave NE Unit 504
- 2435 Franklin Ave NE
- 306 21st St NE
- 203 27th St NE
- 130 Thompson Dr SE Unit 212
- 130 Thompson Dr SE Unit 320
- 127 24th Street Dr SE
- 100 Thompson Dr SE Unit 320
- 100 Thompson Dr SE Unit 212
- 100 Thompson Dr SE Unit 116
- 205 21st St NE
- 2019 G Ave NE
- 2131 1st Ave SE Unit 310