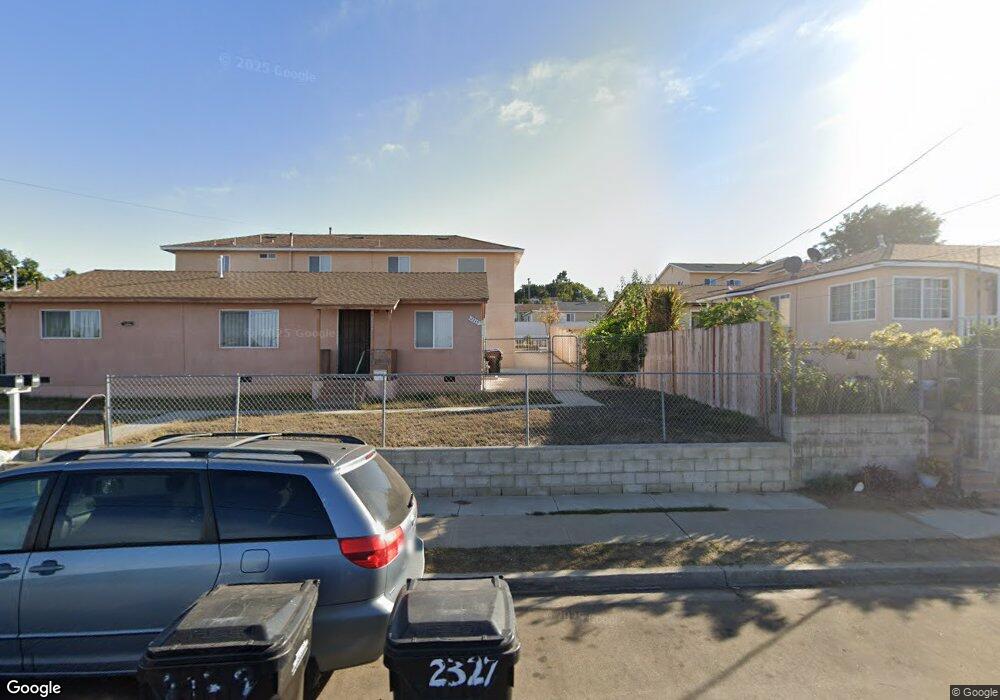
2335 Langmuir St San Diego, CA 92111
Linda Vista NeighborhoodEstimated Value: $1,379,055 - $2,630,000
2
Beds
1
Bath
1,248
Sq Ft
$1,446/Sq Ft
Est. Value
About This Home
This home is located at 2335 Langmuir St, San Diego, CA 92111 and is currently estimated at $1,804,018, approximately $1,445 per square foot. 2335 Langmuir St is a home located in San Diego County with nearby schools including Linda Vista Elementary School, Montgomery Middle School, and San Diego Cooperative Charter School.
Ownership History
Date
Name
Owned For
Owner Type
Purchase Details
Closed on
Oct 9, 2023
Sold by
Ly/Bobbie Truong & Nguyen Cam-Ha Family
Bought by
Ly Bobbie Truong Family Trust
Current Estimated Value
Purchase Details
Closed on
May 19, 2014
Sold by
Ly Bobbie T
Bought by
Bobbie Truong Ly & Cam Ha Nguyen Family
Purchase Details
Closed on
Sep 11, 2009
Sold by
Us Bank National Association
Bought by
Ly Bobbie T
Purchase Details
Closed on
Sep 4, 2009
Sold by
Ly Phone
Bought by
Ly Bobbie T
Purchase Details
Closed on
Sep 12, 2007
Sold by
Warren Carol D
Bought by
Us Bank Na
Purchase Details
Closed on
Sep 8, 2003
Sold by
Warren Donald B
Bought by
Warren Carol D
Home Financials for this Owner
Home Financials are based on the most recent Mortgage that was taken out on this home.
Original Mortgage
$255,000
Interest Rate
5.25%
Mortgage Type
Unknown
Create a Home Valuation Report for This Property
The Home Valuation Report is an in-depth analysis detailing your home's value as well as a comparison with similar homes in the area
Home Values in the Area
Average Home Value in this Area
Purchase History
| Date | Buyer | Sale Price | Title Company |
|---|---|---|---|
| Ly Bobbie Truong Family Trust | -- | None Listed On Document | |
| Bobbie Truong Ly & Cam Ha Nguyen Family | -- | None Available | |
| Ly Bobbie T | $283,000 | Lsi Title Company | |
| Ly Bobbie T | -- | Lsi Title Company | |
| Us Bank Na | $384,231 | Accommodation | |
| Warren Carol D | -- | New Century Title Company |
Source: Public Records
Mortgage History
| Date | Status | Borrower | Loan Amount |
|---|---|---|---|
| Previous Owner | Warren Carol D | $255,000 | |
| Closed | Warren Carol D | $50,000 |
Source: Public Records
Tax History Compared to Growth
Tax History
| Year | Tax Paid | Tax Assessment Tax Assessment Total Assessment is a certain percentage of the fair market value that is determined by local assessors to be the total taxable value of land and additions on the property. | Land | Improvement |
|---|---|---|---|---|
| 2025 | $8,697 | $716,359 | $354,460 | $361,899 |
| 2024 | $8,697 | $702,313 | $347,510 | $354,803 |
| 2023 | $8,505 | $688,544 | $340,697 | $347,847 |
| 2022 | $8,278 | $675,044 | $334,017 | $341,027 |
| 2021 | $8,218 | $661,809 | $327,468 | $334,341 |
| 2020 | $8,115 | $655,024 | $324,111 | $330,913 |
| 2019 | $7,968 | $647,781 | $318,256 | $329,525 |
| 2018 | $4,226 | $355,080 | $287,016 | $68,064 |
| 2017 | $4,126 | $348,119 | $281,389 | $66,730 |
| 2016 | $4,056 | $341,294 | $275,872 | $65,422 |
| 2015 | $3,997 | $336,169 | $271,729 | $64,440 |
| 2014 | $3,935 | $329,585 | $266,407 | $63,178 |
Source: Public Records
Map
Nearby Homes
- 6736 Kelly St
- 6492 Lanston St
- 6737 Thomson Ct
- 6728 Thomson Ct
- 2005 Burton St Unit 1
- 2037 Burton St Unit 43
- 2201-7 Burroughs St
- 2525 Inman Ct
- 2675 Comstock St
- 2249-51 W Dunlop St
- 7128 E Hyatt St
- 6338 Caminito Del Pastel Unit 148
- 6340 Caminito Del Pastel Unit 147
- 2216-18 Dunlop St
- 6426 Caminito Listo
- 6422 Caminito Listo
- 6317 Caminito Del Pastel
- 6328-30 Quillan St
- 1948 Westinghouse St
- 1892 Westinghouse St
- 2335 Langmuir St
- 2345 Langmuir St Unit 47
- 2325 Langmuir St Unit 29
- 2356 Comstock St
- 2366 Comstock St
- 2334 Langmuir St Unit 36
- 2346 Comstock St Unit 48
- 2344 Langmuir St Unit 46
- 2324 Langmuir St Unit 26
- 2355 Langmuir St
- 2376 Comstock St
- 2315 Langmuir St Unit 17
- 23352337 Langmuir St
- 2356 Langmuir St
- 2365 Langmuir St
- 2336 Comstock St Unit 38
- 2386 Comstock St Unit 88
- 2314 Langmuir St Unit 16
- 2355 Comstock St
- 2366 Langmuir St Unit 70