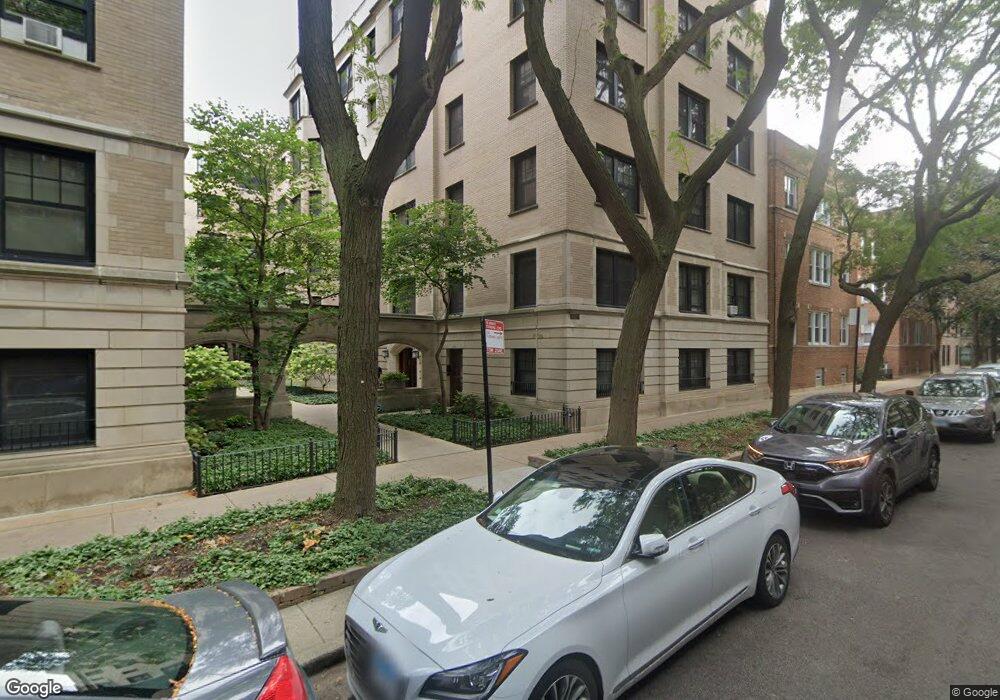
2335 N Commonwealth Ave Unit LO Chicago, IL 60614
Lincoln Park NeighborhoodEstimated Value: $375,000 - $416,387
--
Bed
--
Bath
--
Sq Ft
0.4
Acres
About This Home
This home is located at 2335 N Commonwealth Ave Unit LO, Chicago, IL 60614 and is currently estimated at $400,597. 2335 N Commonwealth Ave Unit LO is a home located in Cook County with nearby schools including Abraham Lincoln Elementary School, Lincoln Park High School, and Guidepost Montessori at Lincoln Park.
Ownership History
Date
Name
Owned For
Owner Type
Purchase Details
Closed on
May 21, 2015
Sold by
Yang Chia Lung
Bought by
Yang Chia Lung and Chia Lung Yang Living Trust
Current Estimated Value
Purchase Details
Closed on
Jun 5, 2014
Sold by
Edelstein Daniel O
Bought by
Yang Chia Lung
Home Financials for this Owner
Home Financials are based on the most recent Mortgage that was taken out on this home.
Original Mortgage
$223,250
Outstanding Balance
$170,889
Interest Rate
4.37%
Mortgage Type
New Conventional
Estimated Equity
$229,709
Purchase Details
Closed on
Mar 21, 1997
Sold by
Steere Michael D and Cross Sue A
Bought by
Edlstein Daniel
Home Financials for this Owner
Home Financials are based on the most recent Mortgage that was taken out on this home.
Original Mortgage
$140,000
Interest Rate
7.82%
Mortgage Type
Purchase Money Mortgage
Create a Home Valuation Report for This Property
The Home Valuation Report is an in-depth analysis detailing your home's value as well as a comparison with similar homes in the area
Home Values in the Area
Average Home Value in this Area
Purchase History
| Date | Buyer | Sale Price | Title Company |
|---|---|---|---|
| Yang Chia Lung | -- | Attorney | |
| Yang Chia Lung | $235,000 | Chicago Title Insurance Co | |
| Edlstein Daniel | $145,000 | -- |
Source: Public Records
Mortgage History
| Date | Status | Borrower | Loan Amount |
|---|---|---|---|
| Open | Yang Chia Lung | $223,250 | |
| Previous Owner | Edlstein Daniel | $140,000 |
Source: Public Records
Tax History Compared to Growth
Tax History
| Year | Tax Paid | Tax Assessment Tax Assessment Total Assessment is a certain percentage of the fair market value that is determined by local assessors to be the total taxable value of land and additions on the property. | Land | Improvement |
|---|---|---|---|---|
| 2024 | $6,330 | $32,307 | $4,330 | $27,977 |
| 2023 | $5,467 | $30,000 | $3,492 | $26,508 |
| 2022 | $5,467 | $30,000 | $3,492 | $26,508 |
| 2021 | $5,363 | $29,999 | $3,492 | $26,507 |
| 2020 | $5,120 | $26,086 | $3,072 | $23,014 |
| 2019 | $5,692 | $28,332 | $3,072 | $25,260 |
| 2018 | $5,597 | $28,332 | $3,072 | $25,260 |
| 2017 | $5,836 | $27,112 | $2,514 | $24,598 |
| 2016 | $5,430 | $27,112 | $2,514 | $24,598 |
| 2015 | $4,968 | $27,112 | $2,514 | $24,598 |
| 2014 | $3,603 | $21,985 | $1,885 | $20,100 |
| 2013 | $3,520 | $21,985 | $1,885 | $20,100 |
Source: Public Records
Map
Nearby Homes
- 2339 N Commonwealth Ave Unit 4C
- 2336 N Commonwealth Ave Unit 107
- 2314 N Lincoln Park W Unit 8-9S
- 399 W Fullerton Pkwy Unit 16E
- 345 W Fullerton Pkwy Unit 1806
- 345 W Fullerton Pkwy Unit 2605
- 345 W Fullerton Pkwy Unit 1801
- 345 W Fullerton Pkwy Unit 2101
- 345 W Fullerton Pkwy Unit 1706
- 345 W Fullerton Pkwy Unit 603
- 345 W Fullerton Pkwy Unit 1001
- 2300 N Commonwealth Ave Unit 7D
- 347 W Belden Ave
- 2400 N Lakeview Ave Unit 1708
- 2400 N Lakeview Ave Unit 1106
- 2400 N Lakeview Ave Unit 2804
- 2440 N Lakeview Ave Unit 11D
- 416 W Grant Place Unit I
- 444 W Fullerton Pkwy Unit 601
- 2342 N Cleveland Ave
- 2335 N Commonwealth Ave Unit 1A
- 2335 N Commonwealth Ave Unit 2D
- 2335 N Commonwealth Ave Unit 5B
- 2335 N Commonwealth Ave Unit 3G
- 2335 N Commonwealth Ave Unit 2E
- 2335 N Commonwealth Ave Unit 1G
- 2335 N Commonwealth Ave Unit 1B
- 2335 N Commonwealth Ave Unit 3E
- 2335 N Commonwealth Ave Unit 2H
- 2335 N Commonwealth Ave Unit 3H
- 2335 N Commonwealth Ave Unit 4G
- 2335 N Commonwealth Ave Unit 5E
- 2335 N Commonwealth Ave Unit 5G
- 2335 N Commonwealth Ave Unit 1H
- 2335 N Commonwealth Ave Unit 3C
- 2335 N Commonwealth Ave Unit 5D
- 2335 N Commonwealth Ave Unit 4F
- 2335 N Commonwealth Ave Unit 4E
- 2335 N Commonwealth Ave Unit 5C
- 2335 N Commonwealth Ave Unit 5H