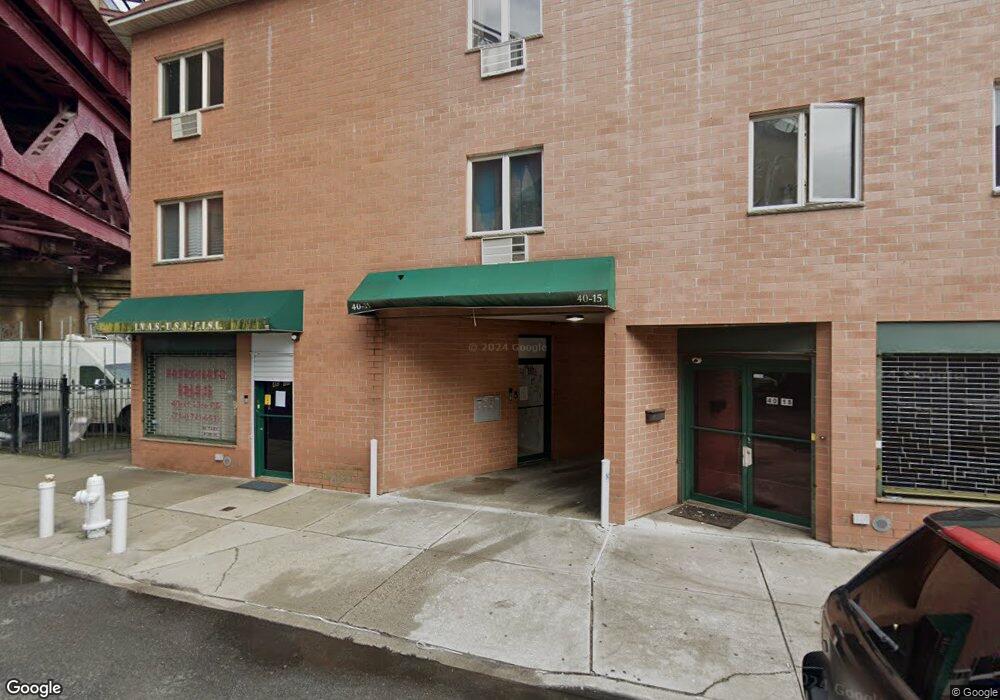
2335 Steinway St Long Island City, NY 11105
Ditmars Steinway NeighborhoodEstimated Value: $2,339,028
--
Bed
--
Bath
6,816
Sq Ft
$343/Sq Ft
Est. Value
About This Home
This home is located at 2335 Steinway St, Long Island City, NY 11105 and is currently estimated at $2,339,028, approximately $343 per square foot. 2335 Steinway St is a home located in Queens County with nearby schools including P.S. 84 Steinway, Is 141 The Steinway, and William Cullen Bryant High School.
Ownership History
Date
Name
Owned For
Owner Type
Purchase Details
Closed on
Dec 2, 2010
Sold by
23-35 Steinway Street Llc
Bought by
Pge Metrony Realty Llc
Current Estimated Value
Home Financials for this Owner
Home Financials are based on the most recent Mortgage that was taken out on this home.
Original Mortgage
$270,593
Outstanding Balance
$178,957
Interest Rate
4.24%
Mortgage Type
Commercial
Estimated Equity
$2,188,695
Purchase Details
Closed on
Oct 18, 2005
Sold by
Steinway Development Llc
Bought by
Pinto Domenico and Pinto Maria
Purchase Details
Closed on
Sep 7, 2005
Sold by
Steinway Development Llc
Bought by
23-35 Steinway Street Llc
Purchase Details
Closed on
May 17, 2005
Sold by
Steinway Street Development Corp
Bought by
Steinway Developement Llc
Purchase Details
Closed on
Nov 26, 2001
Sold by
Pinto Domenico and Pinto Maria
Bought by
Steinway Street Developm
Create a Home Valuation Report for This Property
The Home Valuation Report is an in-depth analysis detailing your home's value as well as a comparison with similar homes in the area
Home Values in the Area
Average Home Value in this Area
Purchase History
| Date | Buyer | Sale Price | Title Company |
|---|---|---|---|
| Pge Metrony Realty Llc | $1,300,000 | -- | |
| Pge Metrony Realty Llc | $1,300,000 | -- | |
| Pinto Domenico | -- | -- | |
| Pinto Domenico | -- | -- | |
| 23-35 Steinway Street Llc | $970,000 | -- | |
| 23-35 Steinway Street Llc | $970,000 | -- | |
| Steinway Developement Llc | -- | -- | |
| Steinway Developement Llc | -- | -- | |
| Steinway Street Developm | -- | -- | |
| Steinway Street Developm | -- | -- | |
| Pinto Domenico | -- | -- | |
| Pinto Domenico | -- | -- |
Source: Public Records
Mortgage History
| Date | Status | Borrower | Loan Amount |
|---|---|---|---|
| Open | Pge Metrony Realty Llc | $270,593 | |
| Closed | Pge Metrony Realty Llc | $270,593 |
Source: Public Records
Tax History Compared to Growth
Tax History
| Year | Tax Paid | Tax Assessment Tax Assessment Total Assessment is a certain percentage of the fair market value that is determined by local assessors to be the total taxable value of land and additions on the property. | Land | Improvement |
|---|---|---|---|---|
| 2025 | $70,886 | $567,000 | $162,750 | $404,250 |
| 2024 | $70,886 | $567,000 | $188,873 | $378,127 |
| 2023 | $62,930 | $615,183 | $216,251 | $398,932 |
| 2022 | $69,692 | $781,200 | $223,200 | $558,000 |
| 2021 | $52,238 | $625,050 | $223,200 | $401,850 |
| 2020 | $48,920 | $686,250 | $223,200 | $463,050 |
| 2019 | $44,309 | $697,050 | $223,200 | $473,850 |
| 2018 | $60,189 | $473,218 | $157,316 | $315,902 |
| 2017 | $55,730 | $438,165 | $155,014 | $283,151 |
| 2016 | $35,893 | $438,165 | $155,014 | $283,151 |
| 2015 | $14,991 | $424,585 | $167,670 | $256,915 |
| 2014 | $14,991 | $393,135 | $180,718 | $212,417 |
Source: Public Records
Map
Nearby Homes
- 2374 38th St
- 37-15 24th Ave
- 24-39 38th St Unit B7B8
- 23-65 36th St
- 2451 38th St Unit 7B
- 24-51 38th St Unit B7
- 24-65 38th St Unit D4
- 24-65 38th St Unit A5
- 24-65 38 St Unit D10
- 25-14 43rd St
- 43-16 25th Ave
- 22-44 43rd St
- 2244 43rd St
- 24-75 38th St Unit C3
- 24-75 38th St Unit A1
- 24-75 38th St Unit 5C
- 24-75 38th St Unit A10
- 24-75 38th St Unit C9
- 25-34 42nd St
- 25-14 44th St
- 2333 Steinway St
- 23-33 Steinway St
- 23-31 Steinway St
- 2331 Steinway St
- 40-16 23rd Rd Unit 1A
- 2329 Steinway St
- 2329 Steinway St Unit 3
- 2329 Steinway St
- 4015 23rd Rd Unit 2
- 23-27 Steinway St
- 23-27 Steinway St Unit 3
- 2327 Steinway St
- 2323 Steinway St
- 2321 Steinway St
- 23-63 Steinway St
- 2332 41st St
- 2319 Steinway St
- 2330 41st St
- 23-26 Steinway St
- 23-19 Steinway St Unit 1R