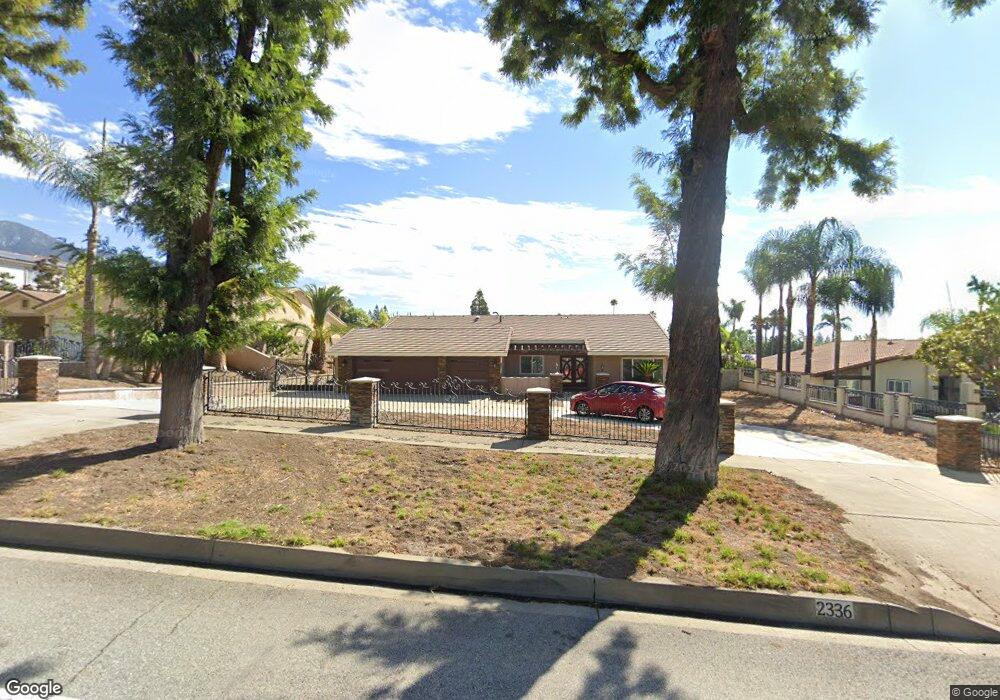
2336 N Euclid Ave Upland, CA 91784
Estimated Value: $1,021,000 - $1,182,000
3
Beds
2
Baths
2,017
Sq Ft
$546/Sq Ft
Est. Value
About This Home
This home is located at 2336 N Euclid Ave, Upland, CA 91784 and is currently estimated at $1,100,456, approximately $545 per square foot. 2336 N Euclid Ave is a home located in San Bernardino County with nearby schools including Magnolia Elementary, Pioneer Junior High School, and Upland High School.
Ownership History
Date
Name
Owned For
Owner Type
Purchase Details
Closed on
Oct 12, 2016
Sold by
Sanchez Jose J
Bought by
Sanchez Jose J and 2000 Jose J Sanchez Revocable
Current Estimated Value
Home Financials for this Owner
Home Financials are based on the most recent Mortgage that was taken out on this home.
Original Mortgage
$204,781
Outstanding Balance
$25,795
Interest Rate
3.5%
Mortgage Type
New Conventional
Estimated Equity
$1,074,661
Purchase Details
Closed on
Jul 13, 2005
Sold by
Sanchez Jose J
Bought by
Sanchez Jose J and 2000 Jose J Sanchez Revocable
Purchase Details
Closed on
Nov 22, 2002
Sold by
Brophy Lawrence M
Bought by
Sanchez Jose J
Home Financials for this Owner
Home Financials are based on the most recent Mortgage that was taken out on this home.
Original Mortgage
$240,000
Interest Rate
5.83%
Purchase Details
Closed on
Apr 22, 2000
Sold by
Brophy Lawrence
Bought by
Brophy Lawrence M and Brophy Jacqueline M
Create a Home Valuation Report for This Property
The Home Valuation Report is an in-depth analysis detailing your home's value as well as a comparison with similar homes in the area
Home Values in the Area
Average Home Value in this Area
Purchase History
| Date | Buyer | Sale Price | Title Company |
|---|---|---|---|
| Sanchez Jose J | -- | Accommodation | |
| Sanchez Jose J | -- | Wfg National Title | |
| Sanchez Jose J | -- | None Available | |
| Sanchez Jose J | $460,000 | Southland Title | |
| Brophy Lawrence M | -- | -- |
Source: Public Records
Mortgage History
| Date | Status | Borrower | Loan Amount |
|---|---|---|---|
| Open | Sanchez Jose J | $204,781 | |
| Previous Owner | Sanchez Jose J | $240,000 |
Source: Public Records
Tax History
| Year | Tax Paid | Tax Assessment Tax Assessment Total Assessment is a certain percentage of the fair market value that is determined by local assessors to be the total taxable value of land and additions on the property. | Land | Improvement |
|---|---|---|---|---|
| 2025 | $7,969 | $730,363 | $233,187 | $497,176 |
| 2024 | $7,715 | $716,042 | $228,615 | $487,427 |
| 2023 | $7,598 | $702,002 | $224,132 | $477,870 |
| 2022 | $7,434 | $688,237 | $219,737 | $468,500 |
| 2021 | $7,426 | $674,742 | $215,428 | $459,314 |
| 2020 | $7,224 | $667,823 | $213,219 | $454,604 |
| 2019 | $7,198 | $654,728 | $209,038 | $445,690 |
| 2018 | $7,020 | $641,890 | $204,939 | $436,951 |
| 2017 | $6,816 | $629,304 | $200,921 | $428,383 |
| 2016 | $6,575 | $616,964 | $196,981 | $419,983 |
| 2015 | $6,424 | $607,696 | $194,022 | $413,674 |
| 2014 | $6,258 | $595,792 | $190,221 | $405,571 |
Source: Public Records
Map
Nearby Homes
- 425 E 24th St
- 2414 Vista Dr
- 2464 Prospect Dr
- 680 W Byron Ct
- 389 Deborah Ct
- 2435 Sierra Dr
- 141 W 21st St
- 2337 N San Antonio Ave
- 2335 N San Antonio Ave
- 2532 E Vista Dr
- 2499 Sierra Dr
- 475 W 26th St
- 2061 N Albright Ave
- 7954 Thoroughbred St
- 1942 N 3rd Ave
- 907 Pineridge St
- 2360 N Mountain Ave
- 1140 W 22nd St
- 7906 Appaloosa Ct
- 959 Kenwood St
- 2332 N Euclid Ave
- 2346 N Euclid Ave
- 2335 N 1st Ave
- 2356 N Euclid Ave
- 2322 N Euclid Ave
- 2347 N 1st Ave
- 2329 N 1st Ave
- 2353 N 1st Ave
- 2321 N 1st Ave
- 2314 N Euclid Ave
- 2370 N Euclid Ave
- 2363 N 1st Ave
- 2315 N 1st Ave
- 2339 N Euclid Ave
- 2345 N Euclid Ave
- 2329 N Euclid Ave
- 2376 N Euclid Ave
- 2304 N Euclid Ave
- 2357 N Euclid Ave
- 2321 N Euclid Ave
Your Personal Tour Guide
Ask me questions while you tour the home.